Screenshots
Check out the user interface and how awesome big data can be...


A few words about the screenshots
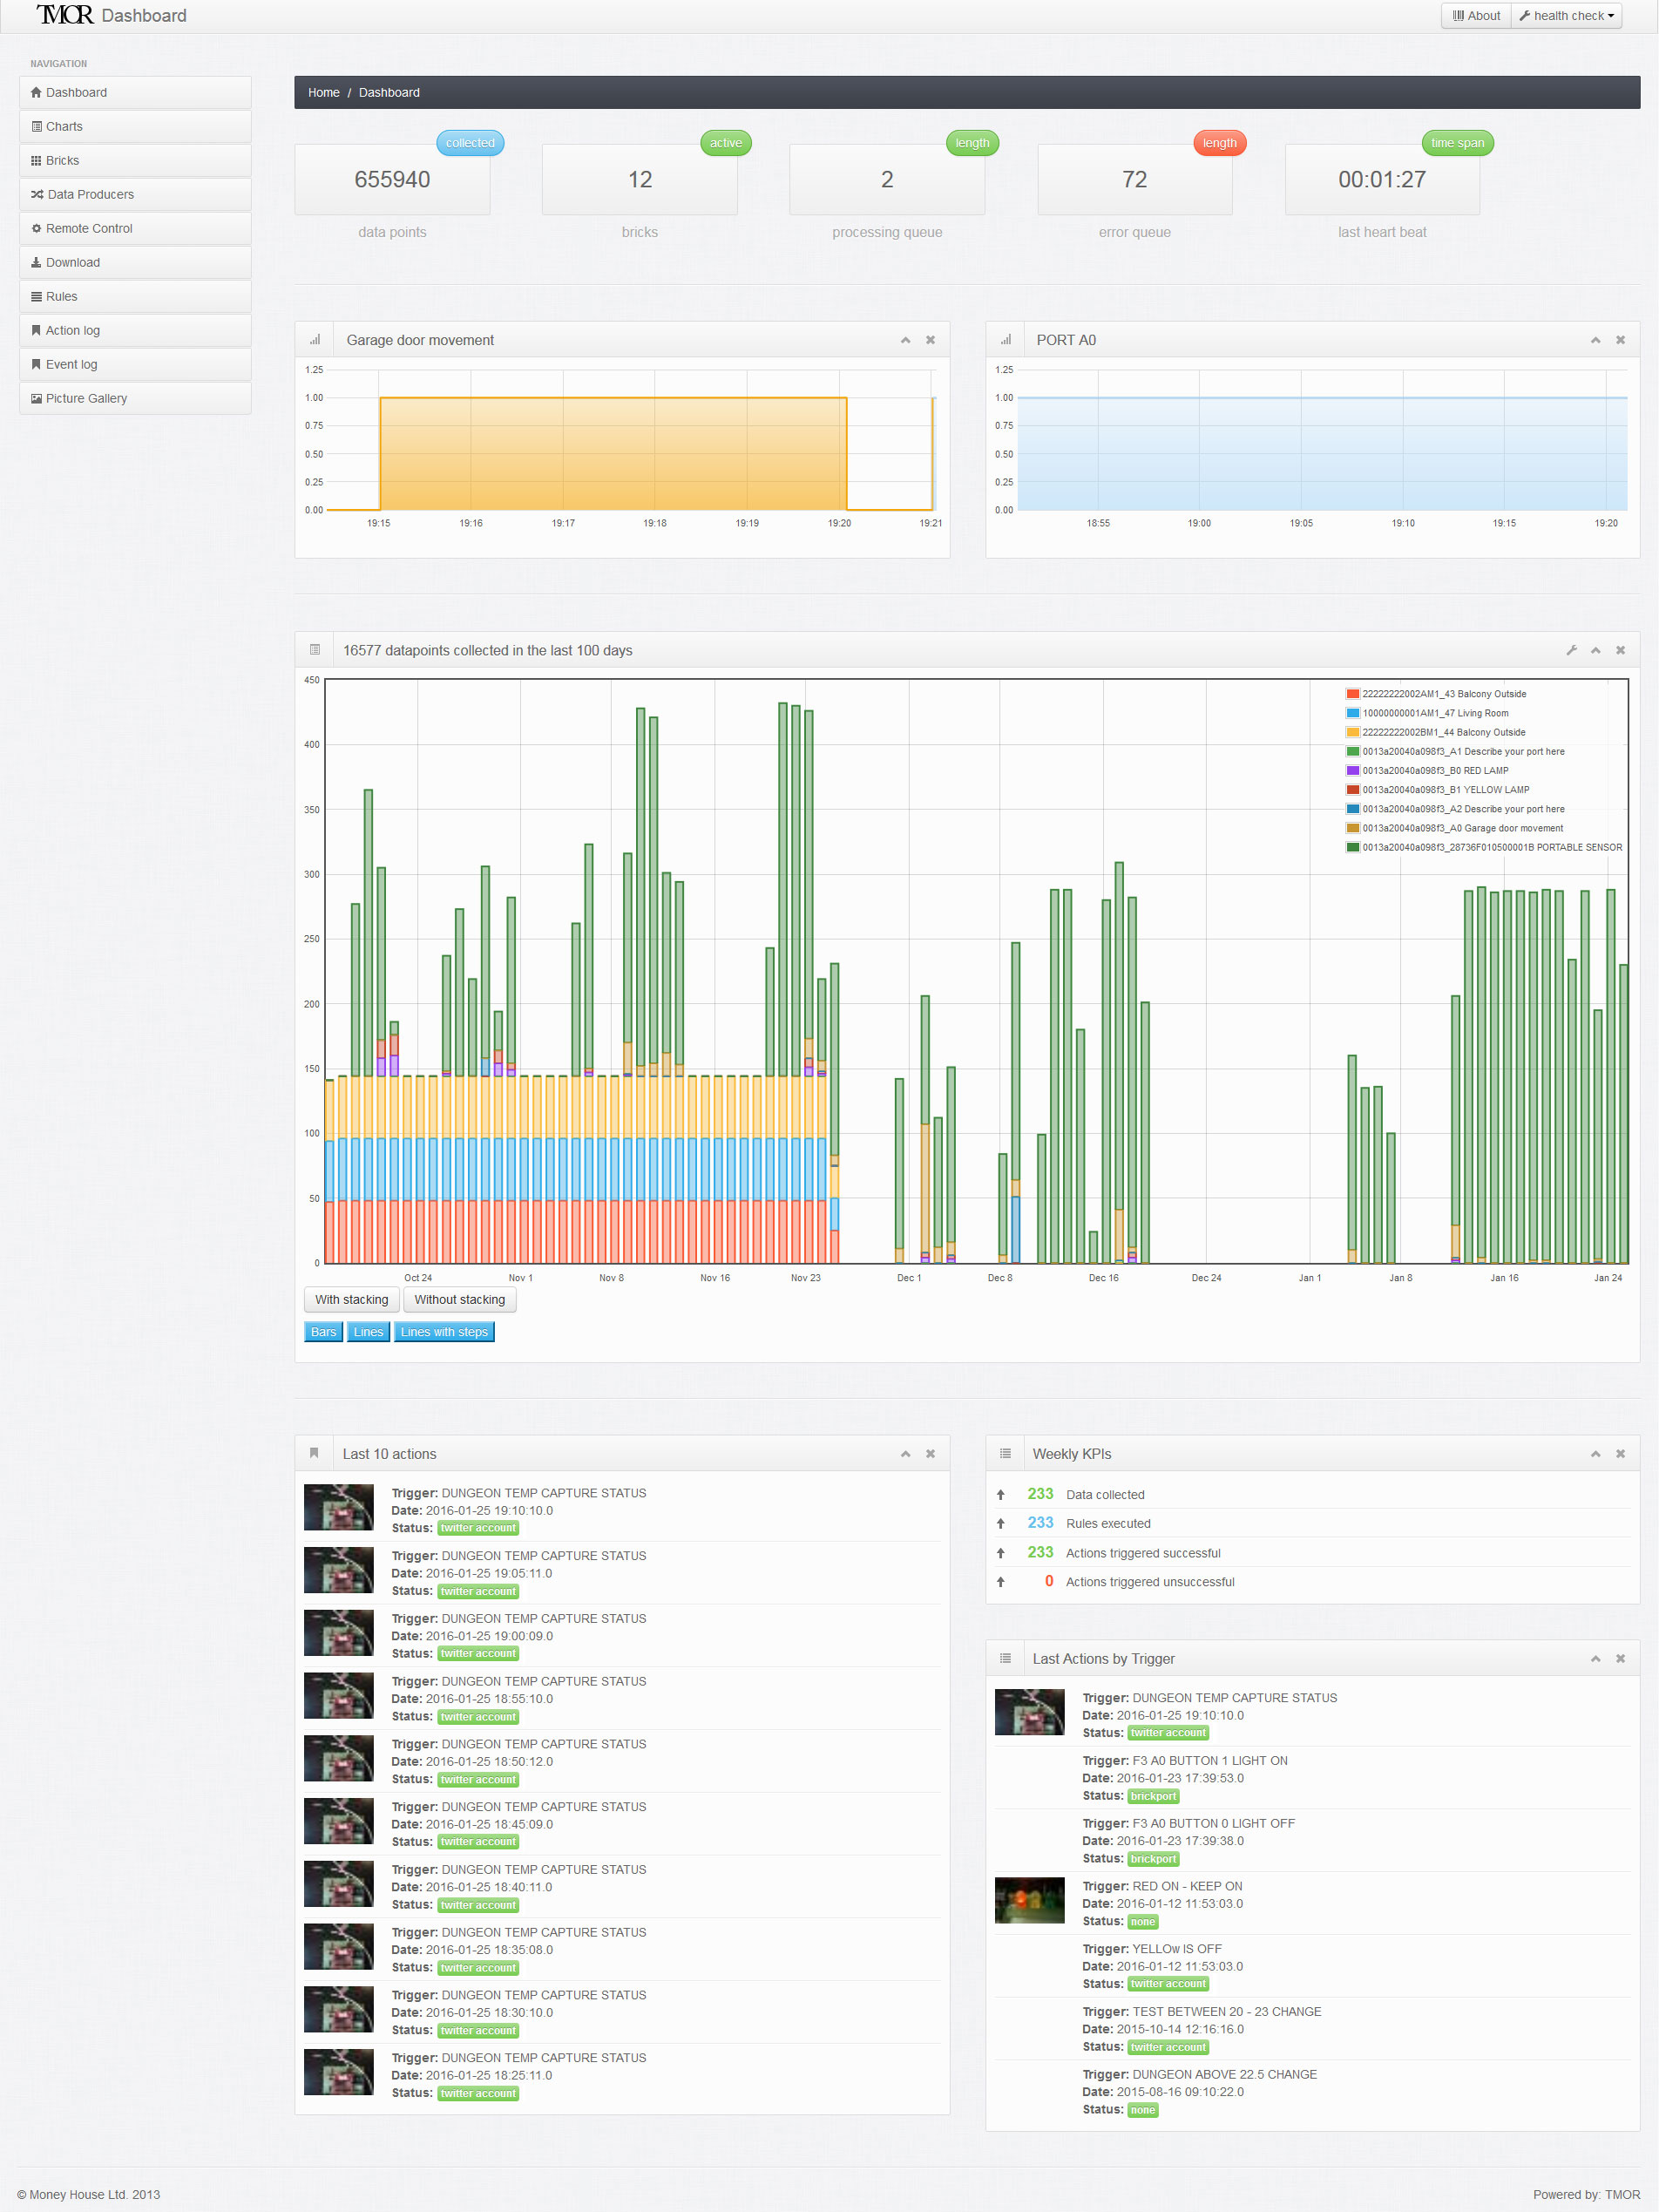
TMOR comes along with a friendly and intuitive user interface. In this section we present some of the most important screens, such as the
- dashboard, for the general overview - form here on you drill down into the details
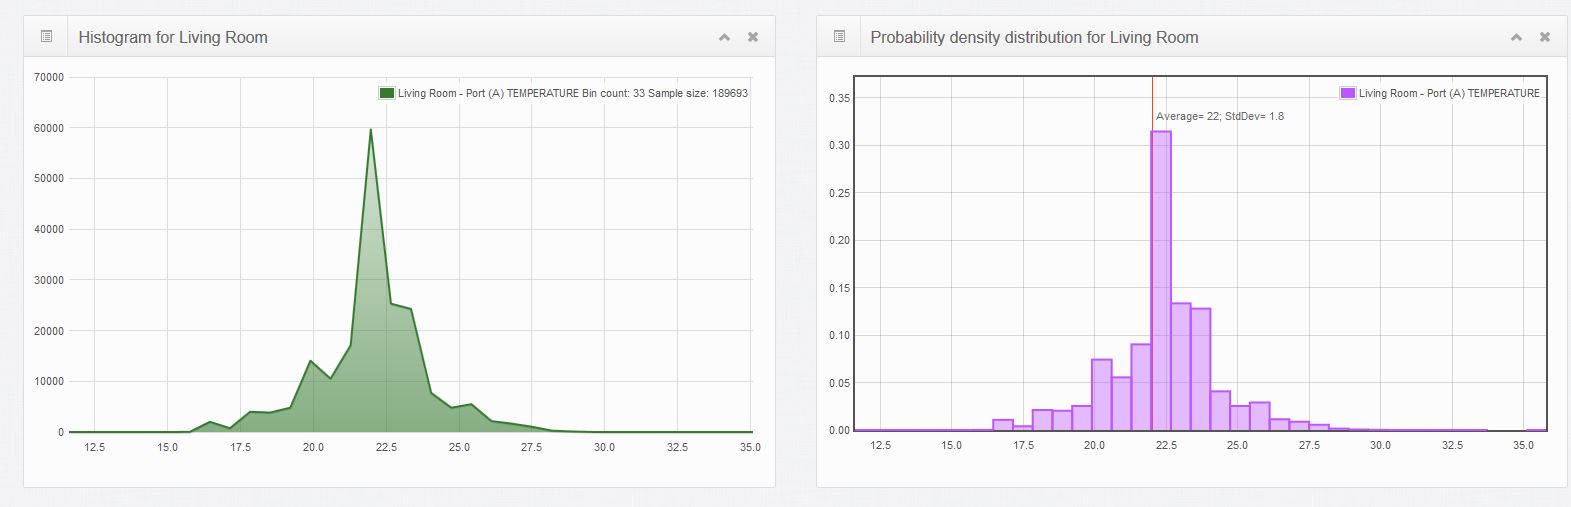
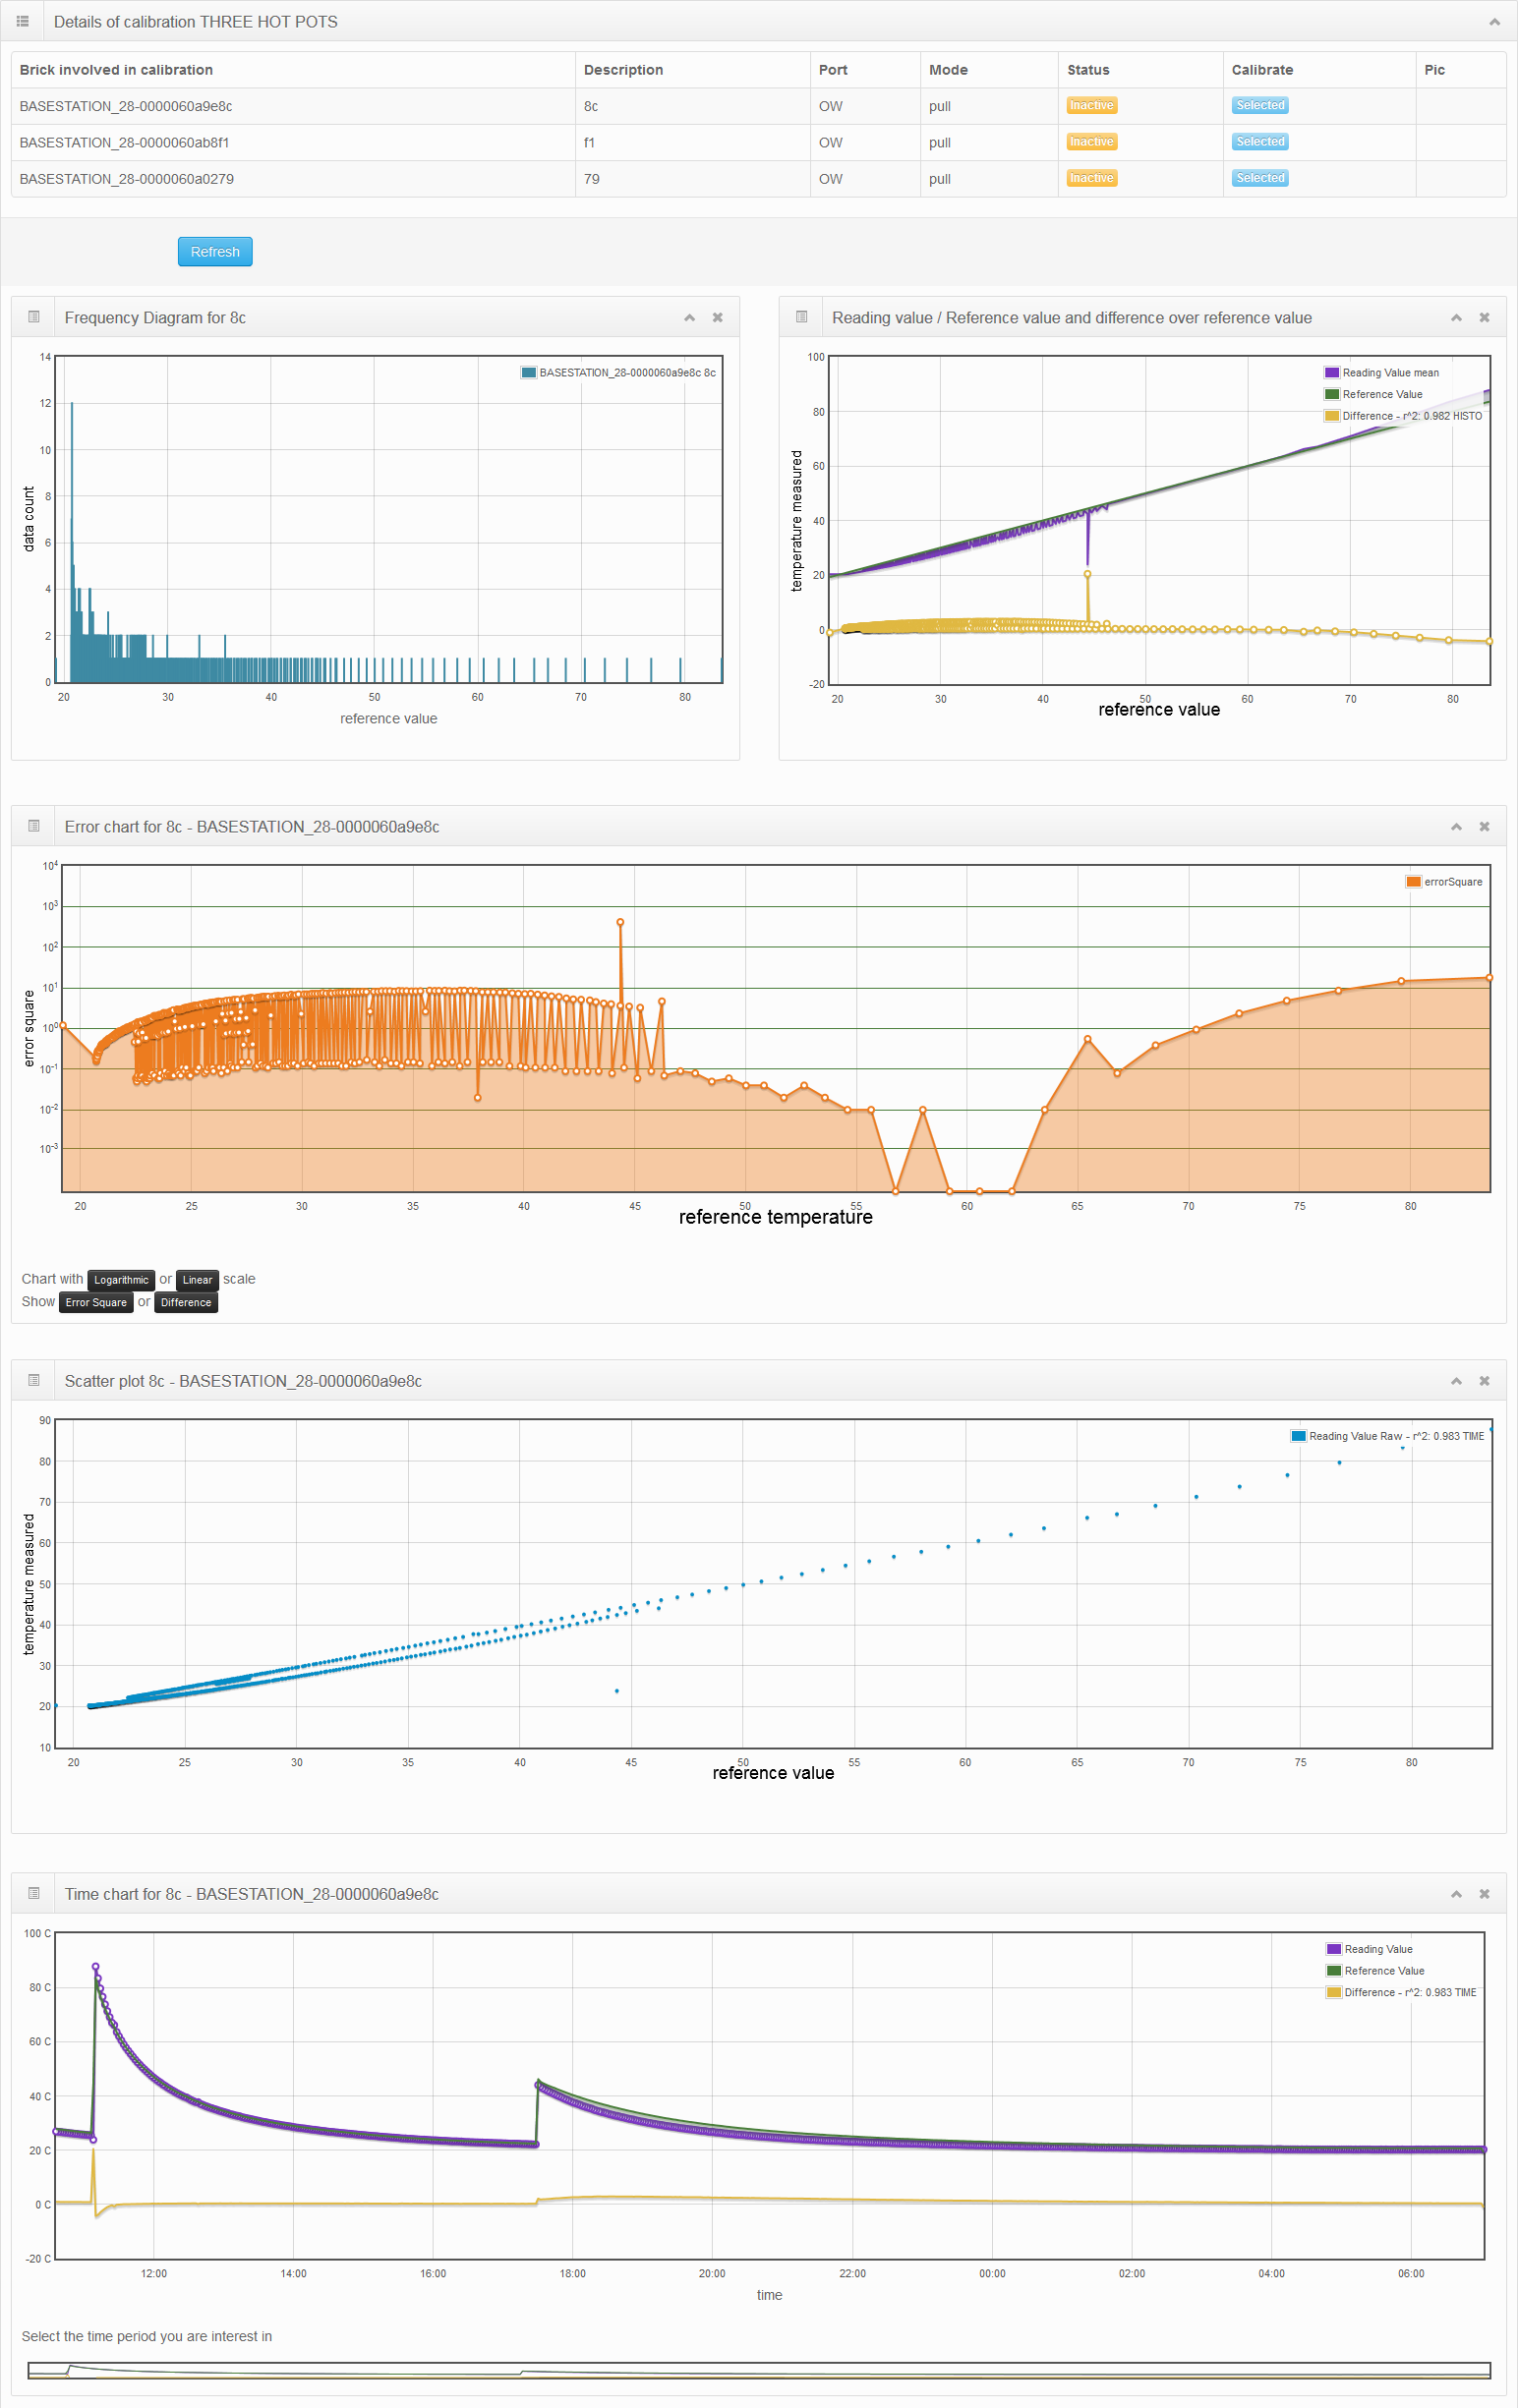
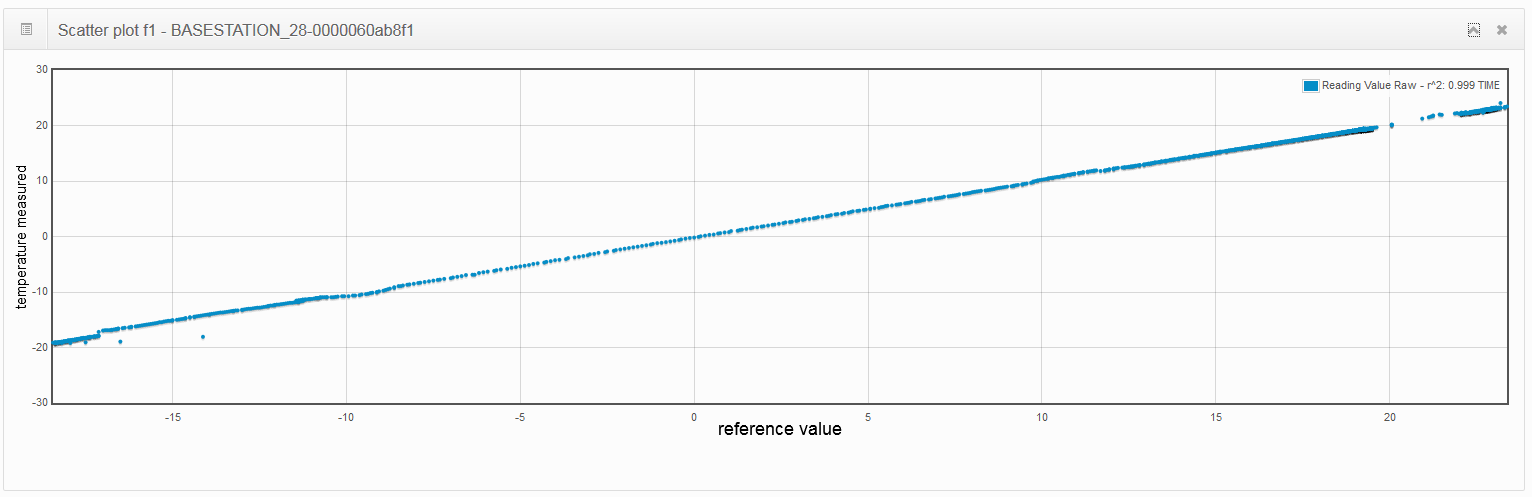
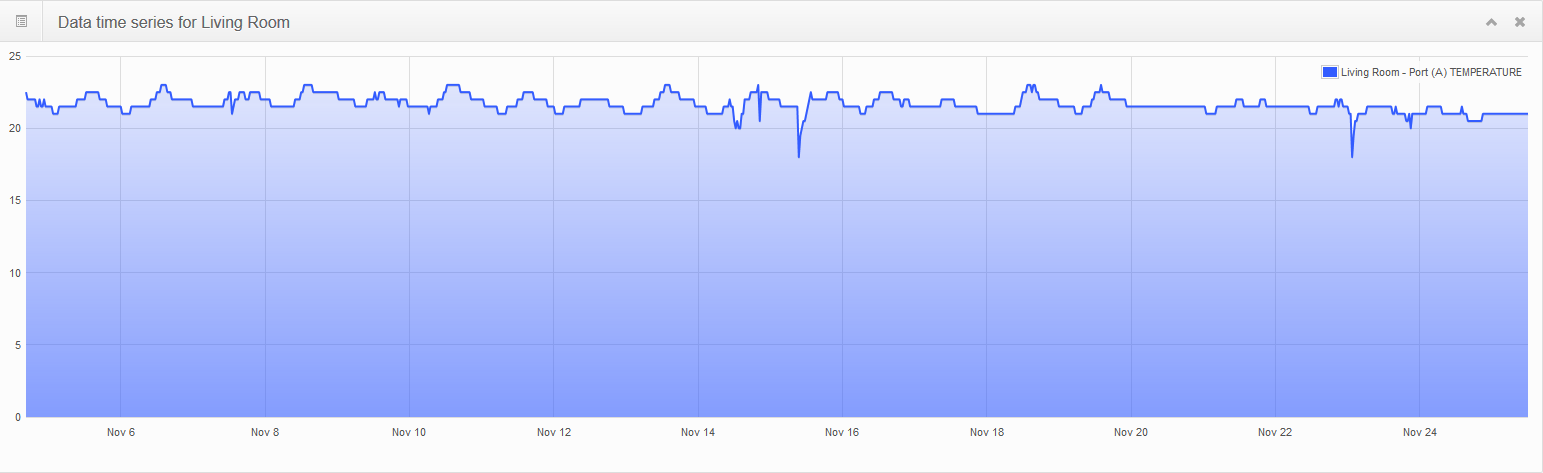
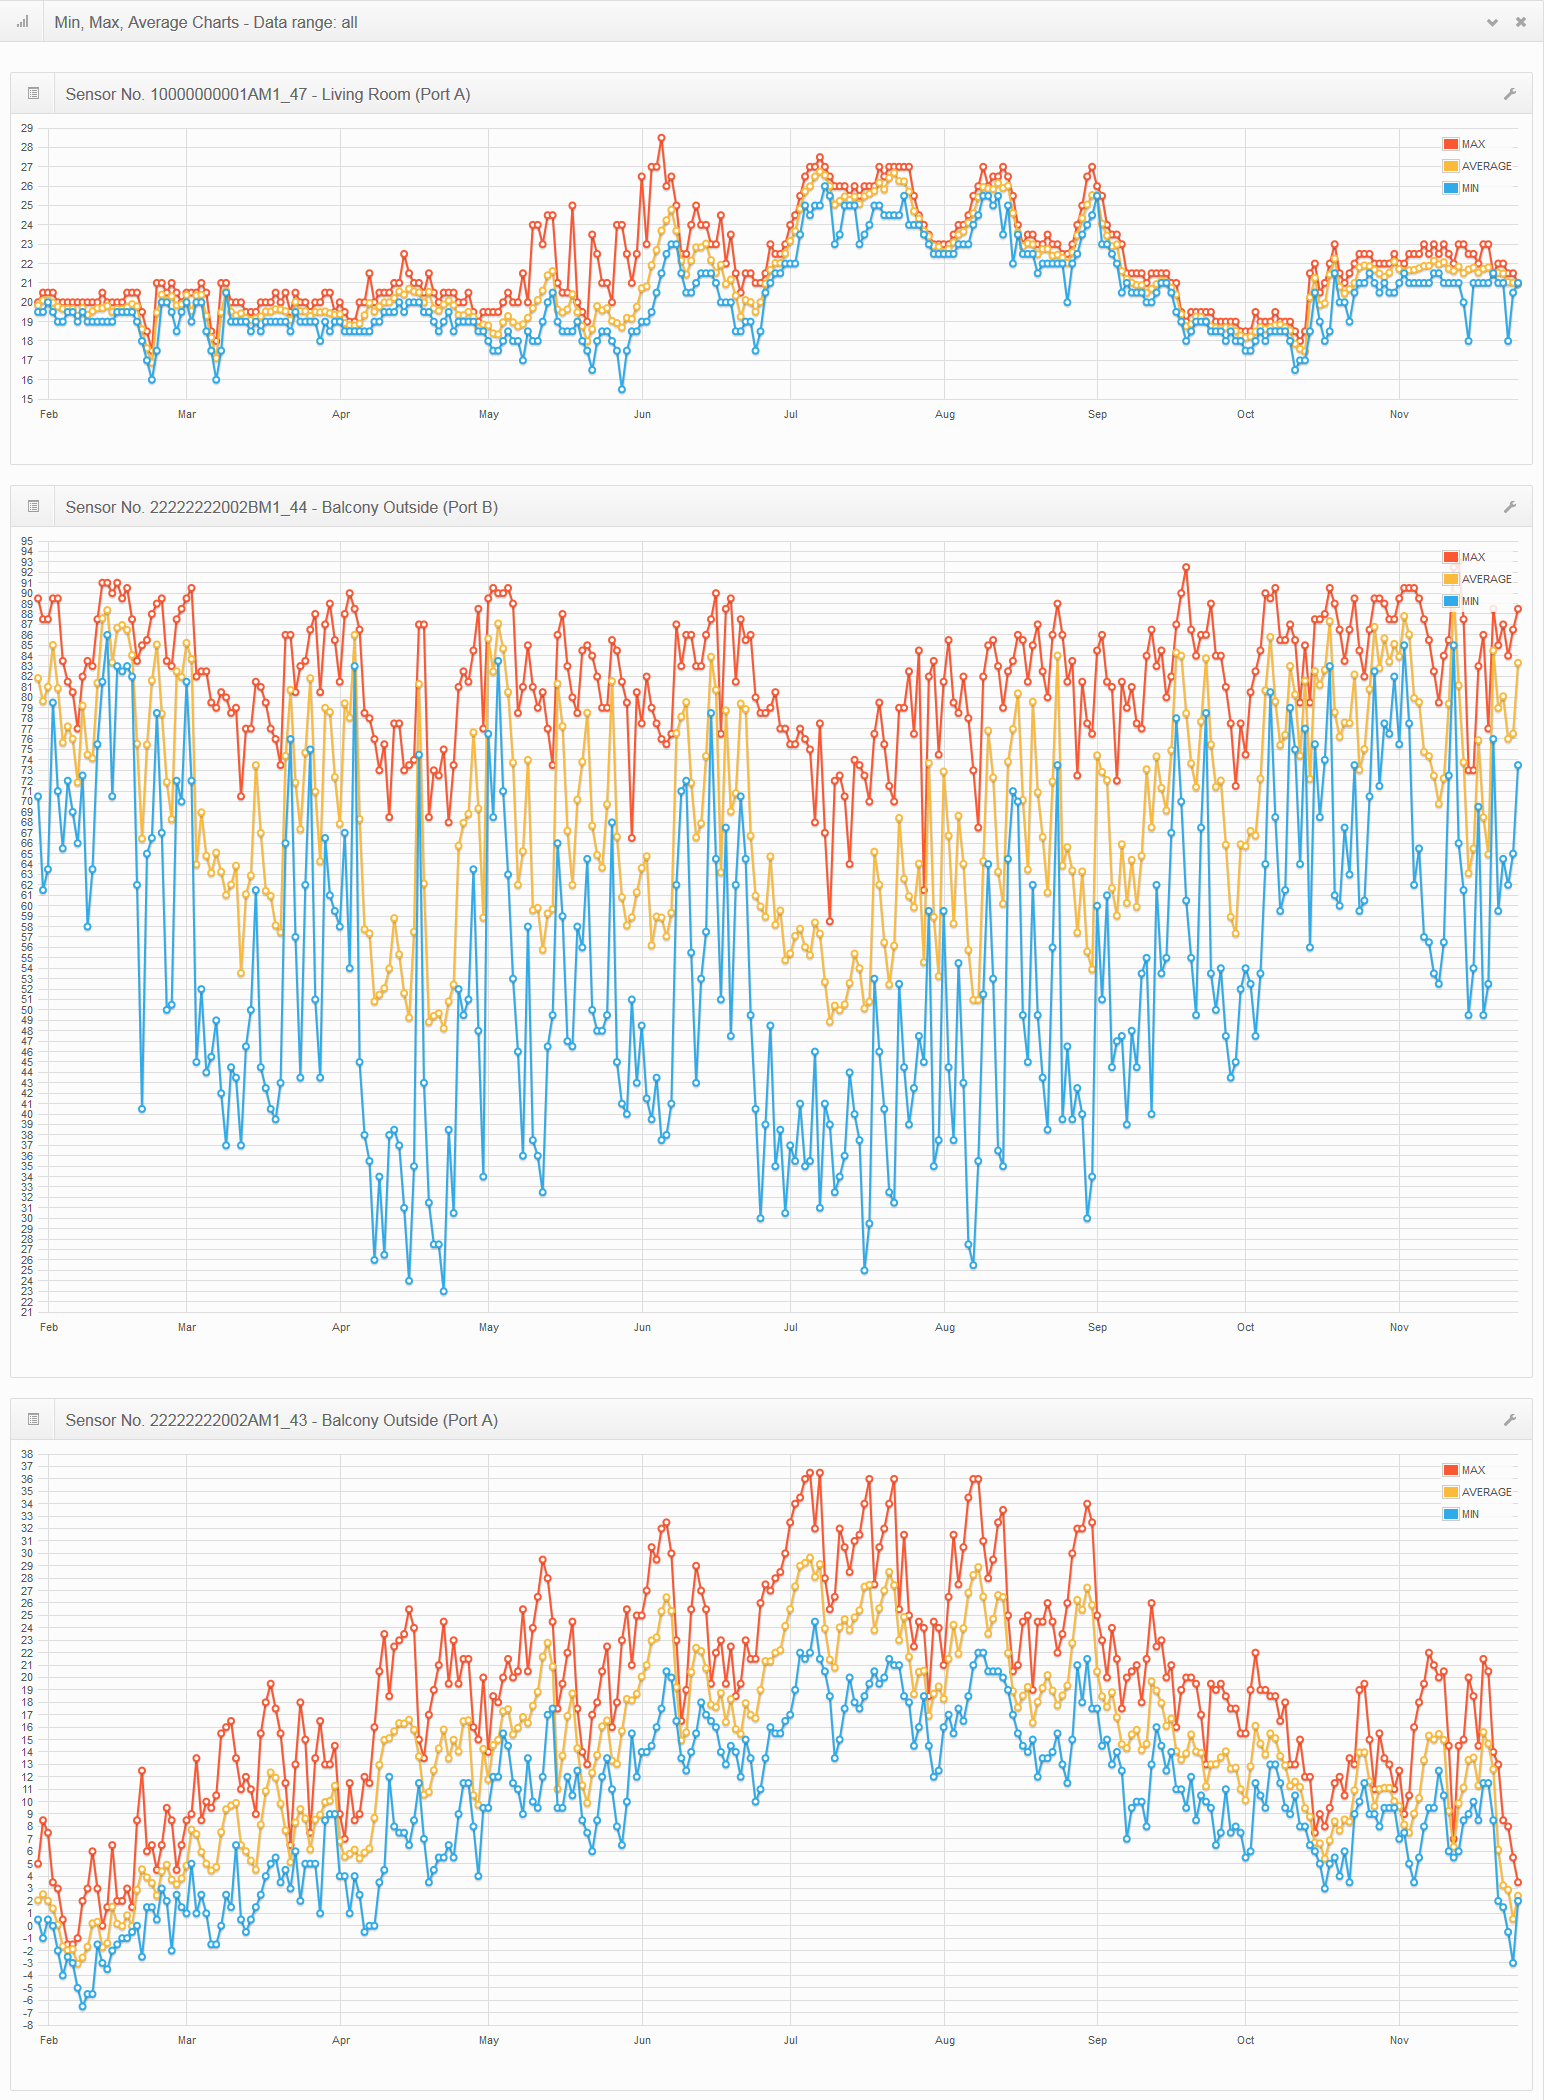
- charts, for visualizing the collected value for each sensor
- bricks, for configuration and status settings for each sensor
- values, for detailed visualization of a specific sensor
- data producers, for quantitative explaination of data produces
- download, for downloading collected data for further treatment like Excel
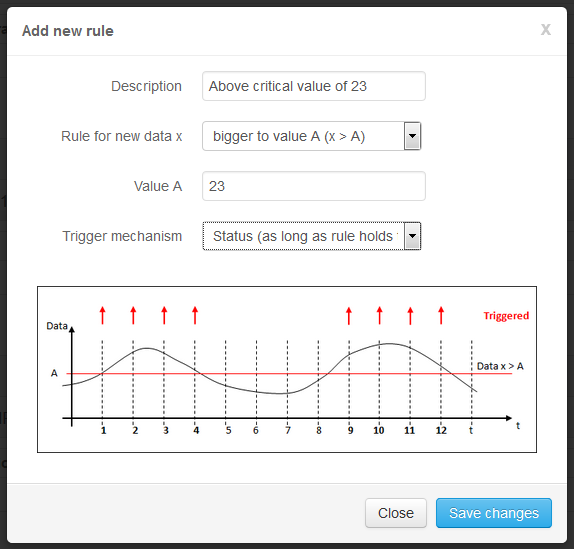
- rules, for defining criteria and actions on the collected data set
- action and event log, for following up on the TMOR settings and its behviour
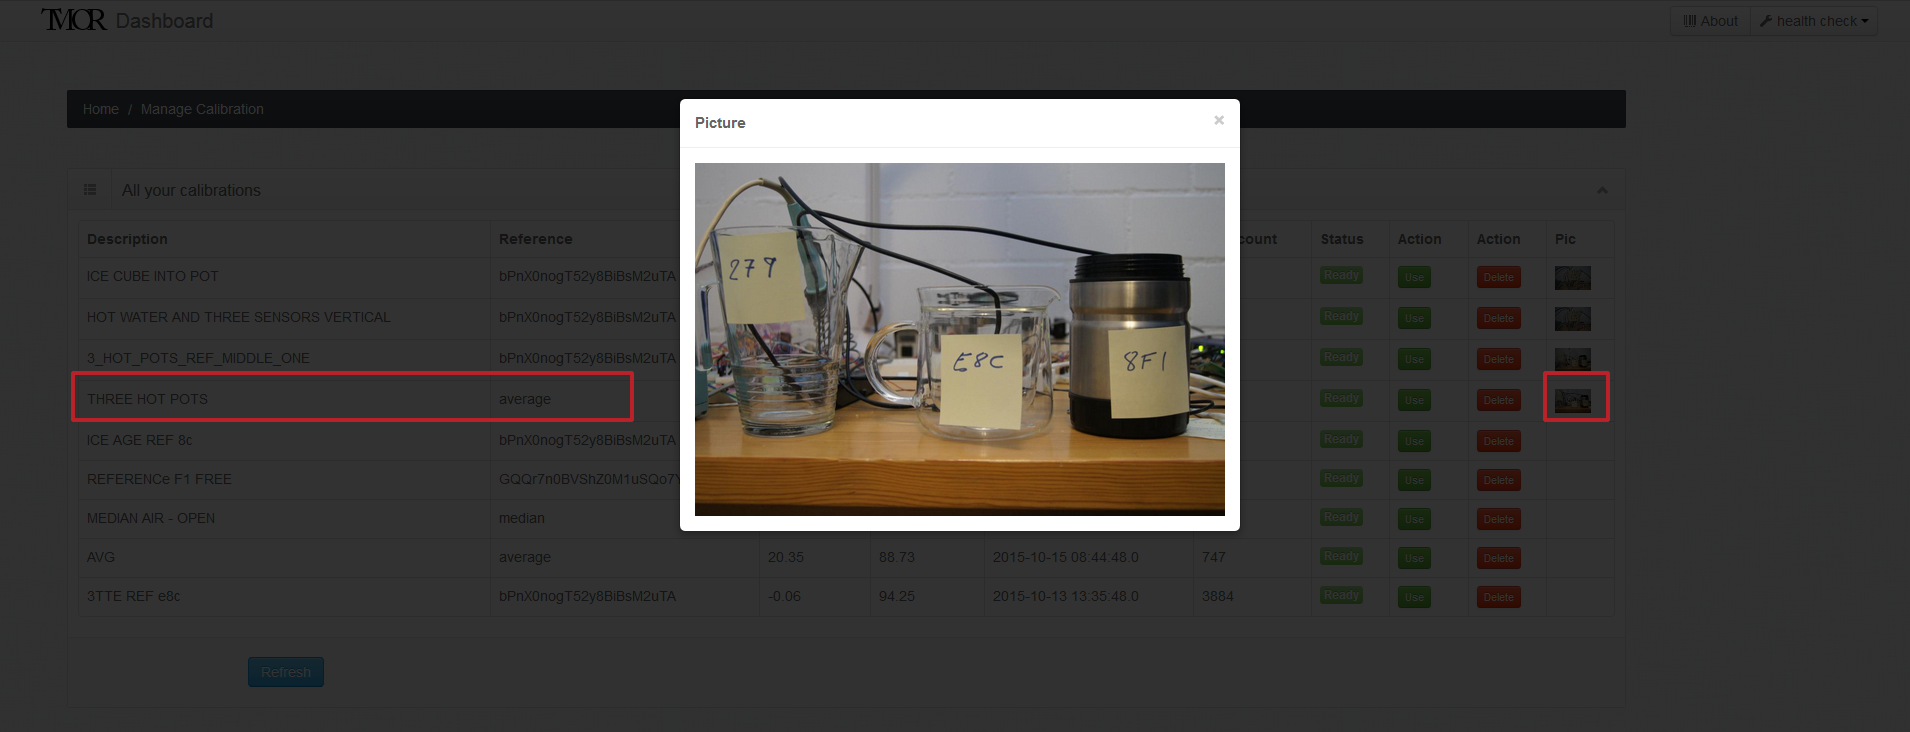
- picture gallery, for organizing and labeling the sensors with your own images