Get started - Base station
Get started with the Base station by following these simple steps:
1. Make sure that Ethernet network cable and power cable are not connected to the Base station
2. Make sure the 1-wire XBee Base station module is properly connected to the Raspberry Pi (or Asus Tinker) as shown here .
3. The 1-wire sensors are connected to the 1-wire XBee Base station module
4. Make sure the provided SD Card is properly inserted into the Raspberry Pi
5. Connect the network cable
6. Connect the Power Cable
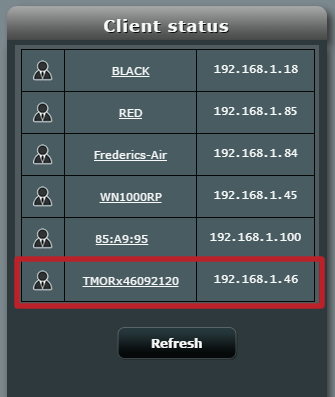
By doing so you should see the status lights of the Raspberry and the 1-wire XBee Base station module blink and flicker. As TMOR Base station starts up you need to figure out which IP address
in you network it occupies.
7. The best way is to look up your Gateway / Router / DHPC server for this. The Entry should look like TMORxYYYYYYYY PI ADDRESS as shown here.
Here you get all the documentation for the TMOR Base station.
*This get started paragraph shadows to some degree the official get started intro. Should you encounter any problems with the above mentioned steps you might find here some help by following their approach.
RasPi becomes TMOR
Connecting 1-wire XBee module to Raspberry Pi (or Asus Tinker)
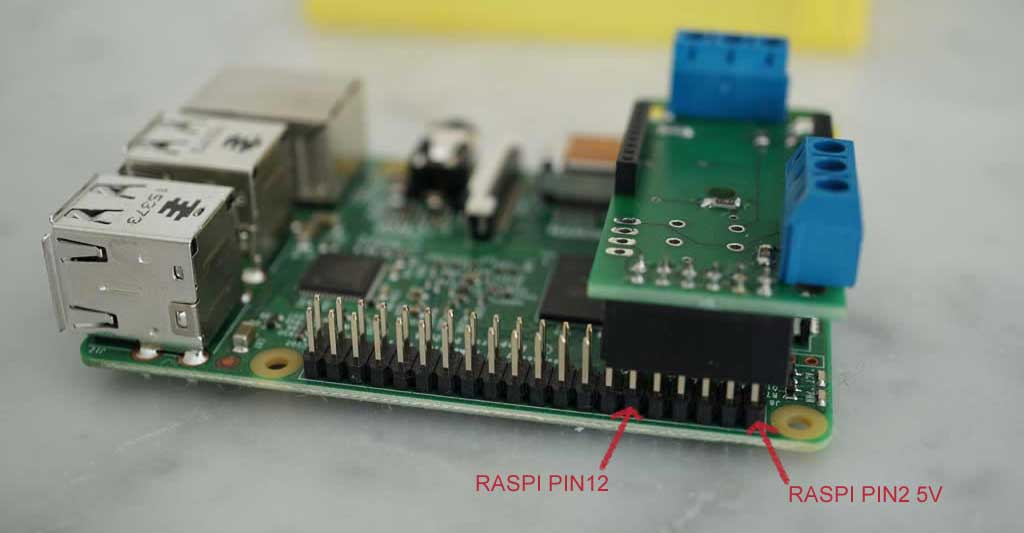
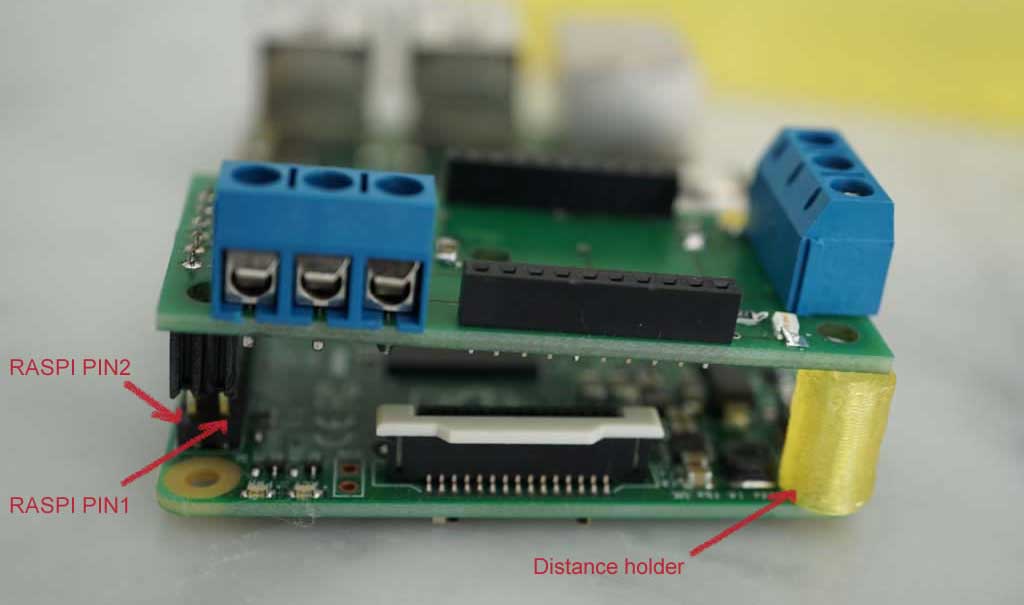
With the 1-wire XBee Base station module your Raspberry Pi transforms into your TMOR base station. The 1-wire XBee Base station module is connected to the GPIO interface of the Raspberry Pi. It is imperative to connect the module correctly as shown in the following two pictures where the proper mounting can be seen from the side and the back. All 12 pins from Pin nr 1 to Pin nr 12 need to be connected to the 1-wire XBee Base station module.
Assembling the TMOR Base station
The following instructions explain in detail how to transform a normal Raspberry Pi Version 2 or 3 into the TMOR base station by using the following components:
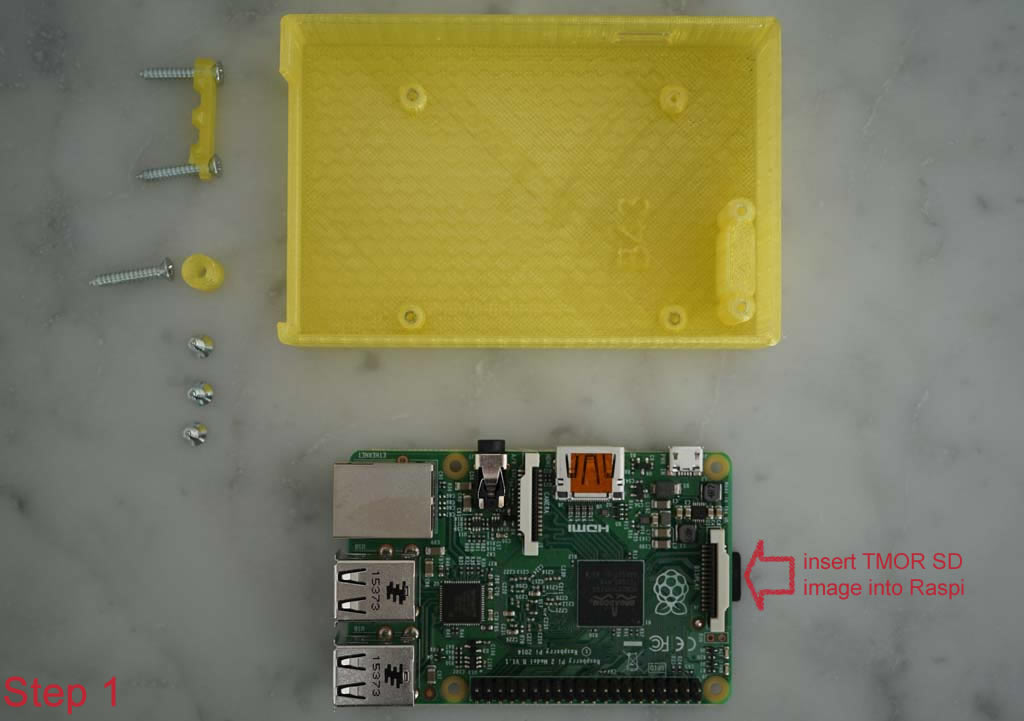
Before you start, lay out the whole set. It should look like this:
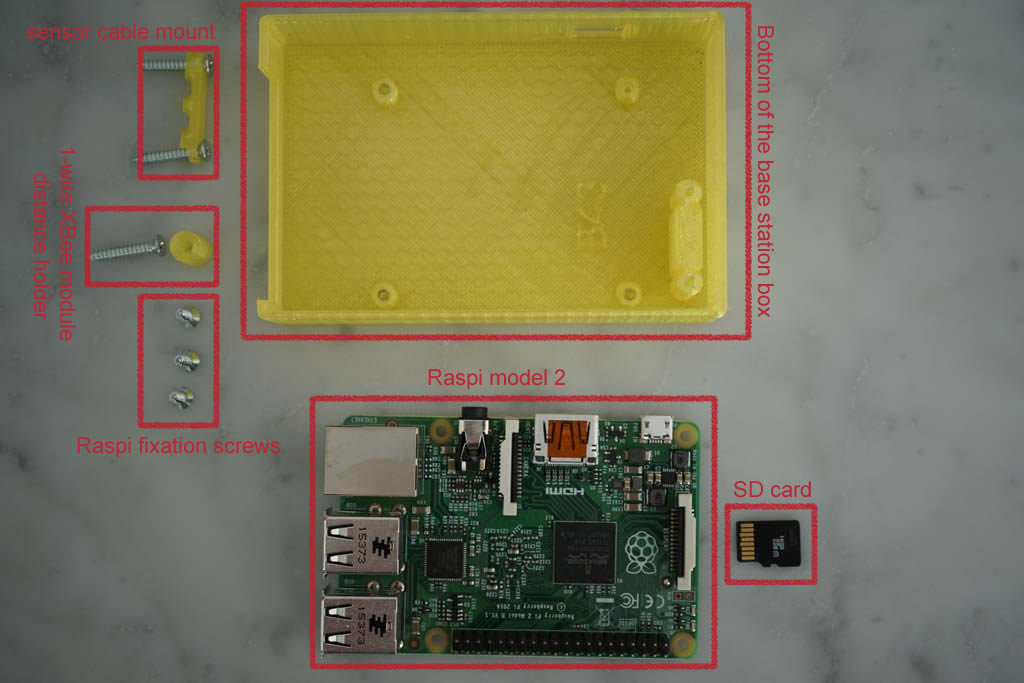
Step 1: Insert the SD Card containing the TMOR system into the Raspberry. How to prepare the SD Card with the TMOR system is described here #### link
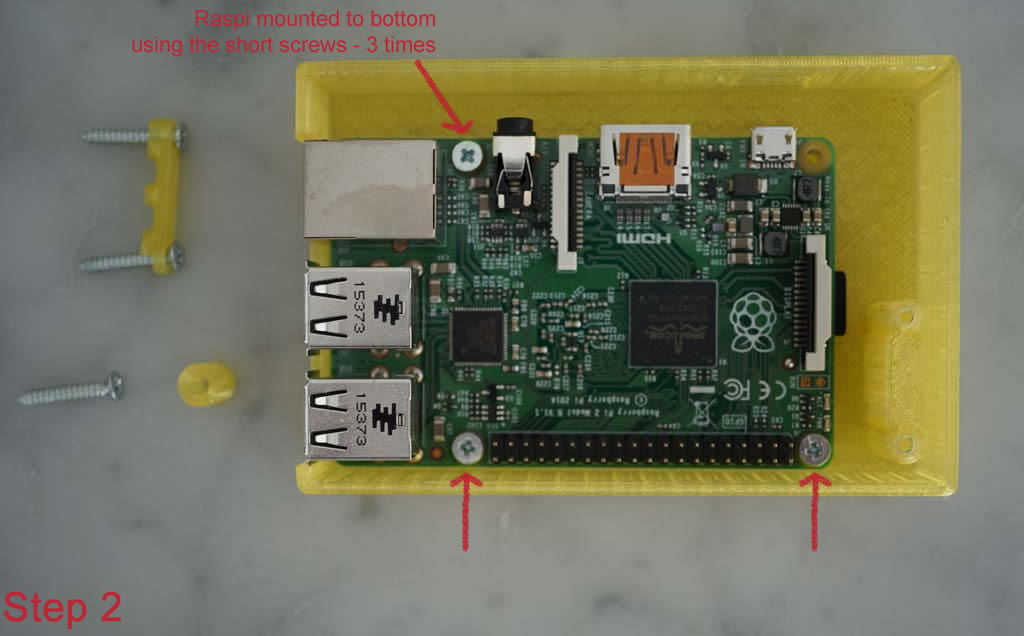
Step 2: Mount the Raspberry Pi into the bottom part of the enclosure box. This step requires a screw driver. For now leave the mount hole next to the power supply (top right) empty.
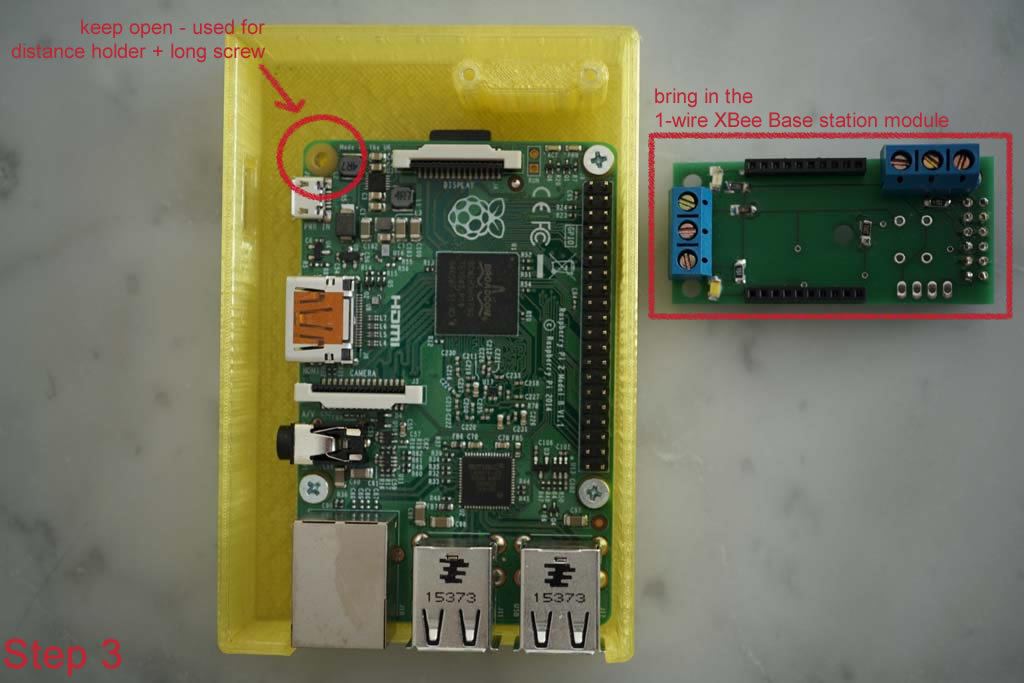
Step 3: It's time to bring in the 1-wire XBee Base station module.
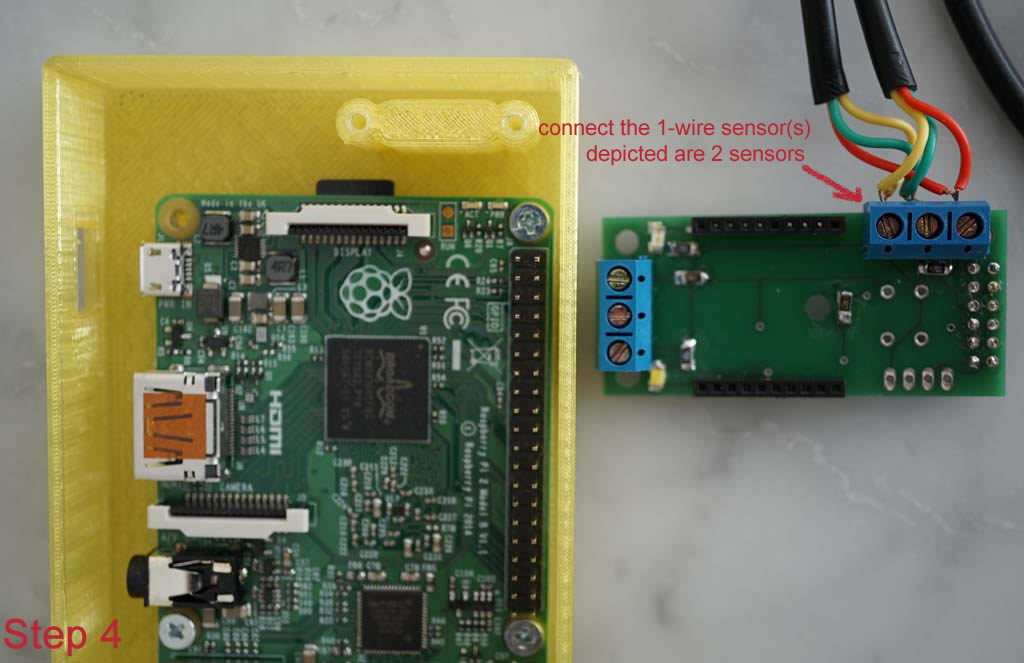
Step 4: Connect the 1-wire sensors to the module. The picture below displays the connection of 2 separate 1-wire sensors. The connection is a follows:
- yellow (left) is GND
- green (middle) is the signal (DQ)
- red (right) is Vcc
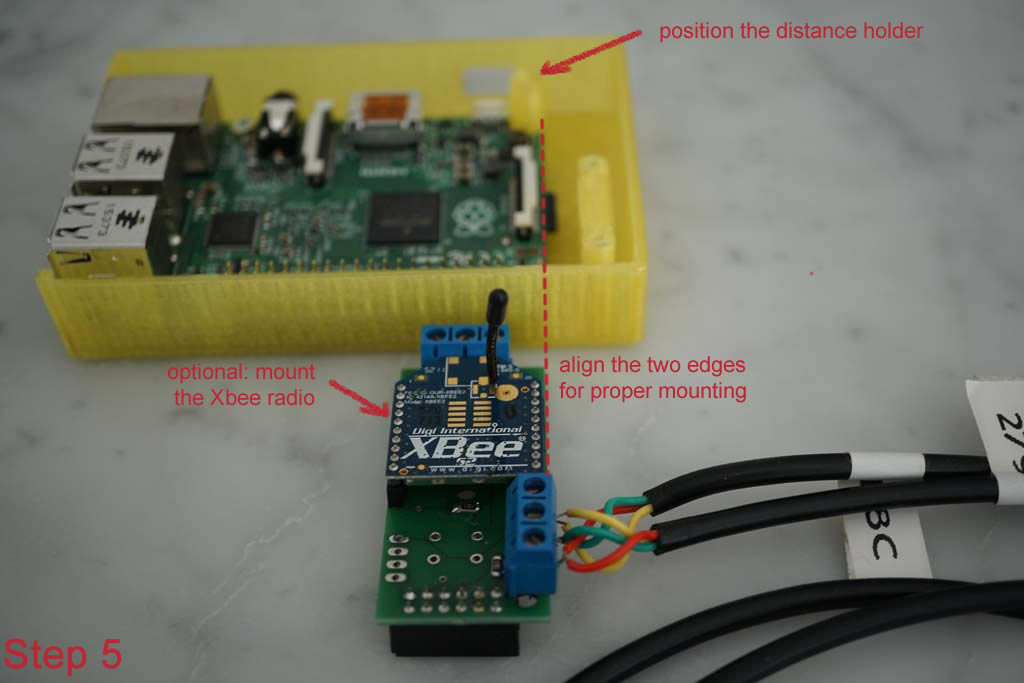
Step 5: If the XBee wireless functionality is needed, then it is time to mount the XBee radio on to the module. Make sure, that the radio is mounted correctly. All 24 pins of the radio must be in the ic socket.
Position the distance holder (the tube with a length of approx. 20 mm) vertically above the empty mount hole. Subsequently insert the 1-wire XBee Base station module carefully into the PGIO port of the RasPi. Make sure, that the two rows are correctly mounted.
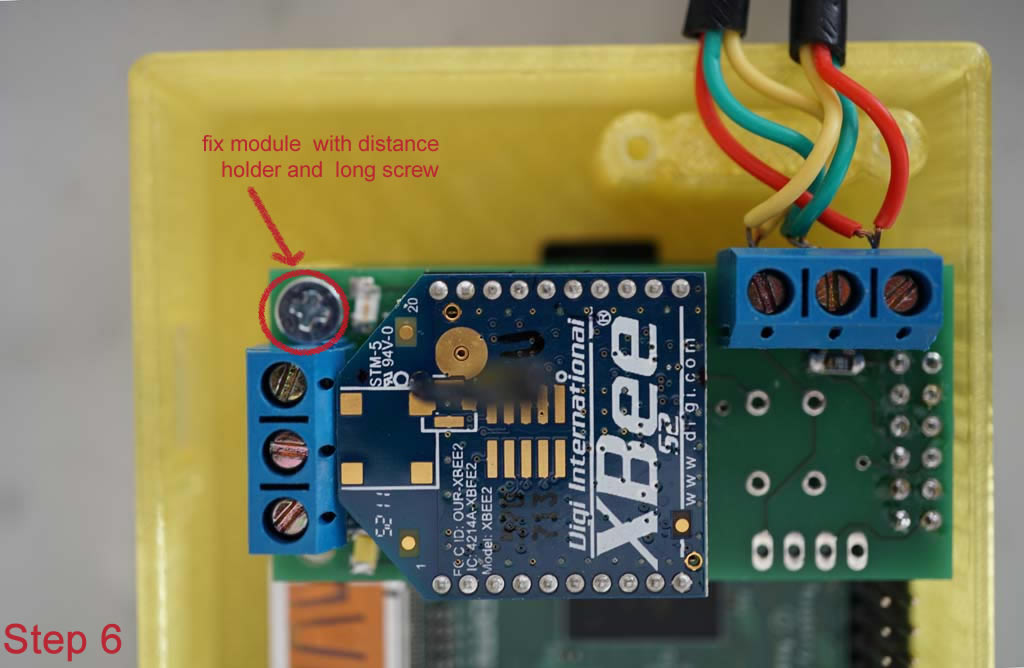
Step 6: Fix the 1-wire XBee Base station module to the Raspberry pi board by using the long screw.
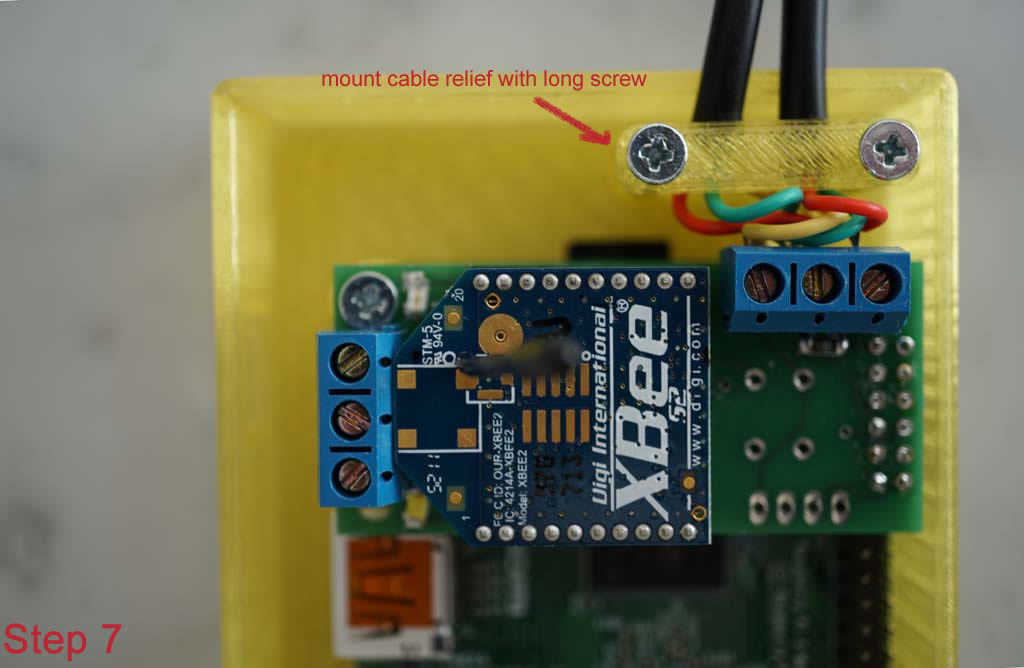
Step 7: Arrange the sensor cables carefully and mount the cable relief with the remaining two long screws.
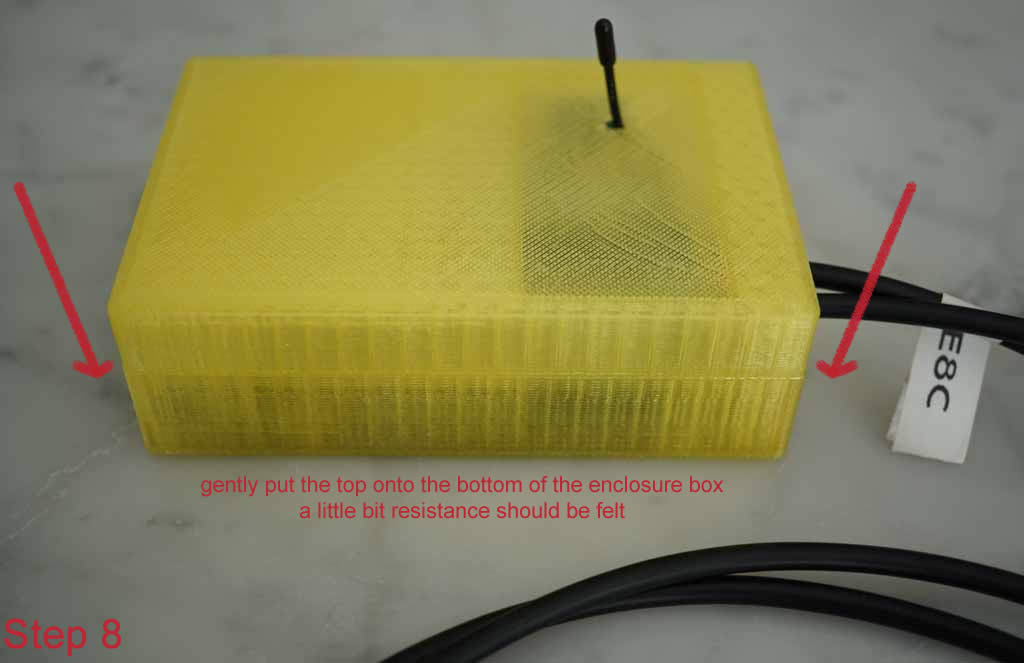
Step 8: Cover the TMOR base station by mounting the top cover. When mounting, there should be a slight resistance at the back side of the mounted 1-wire XBee Base station module as well as in the corners of the box. This is necessary to ensure that the cover does not open unintendedly. In case the XBee radio is mounted, feed the antenna trough the antenna hole of the top part of the case first.
Connecting sensors to the base station
Turn off the TMOR base station before connecting or removing sensors from it. Before operating TMOR we recommend strongly to study the get started section in the TMOR manual.
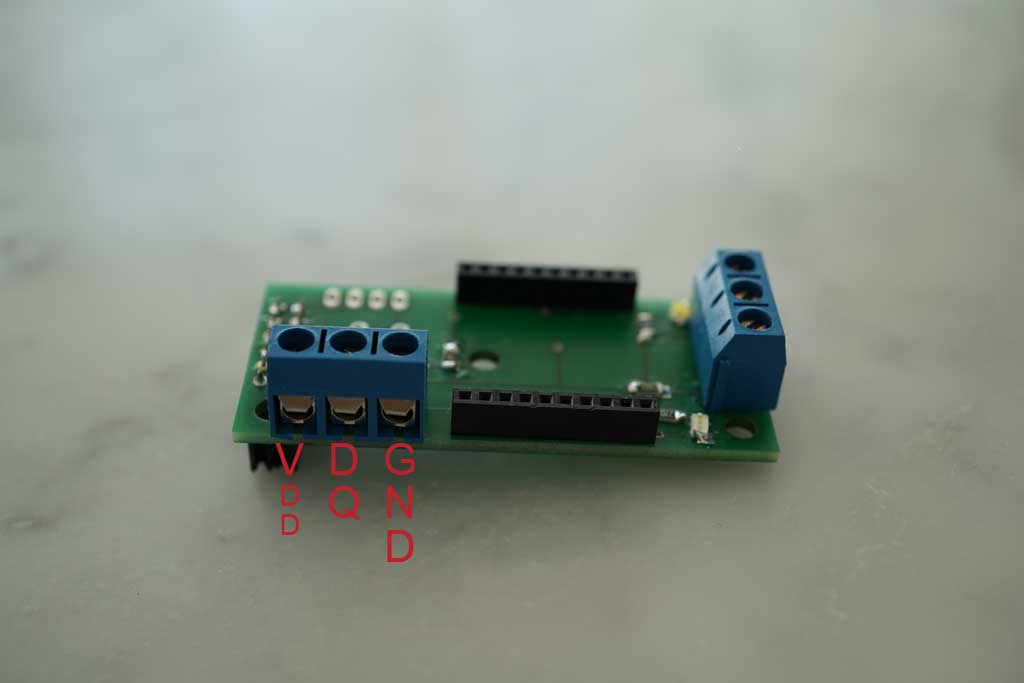
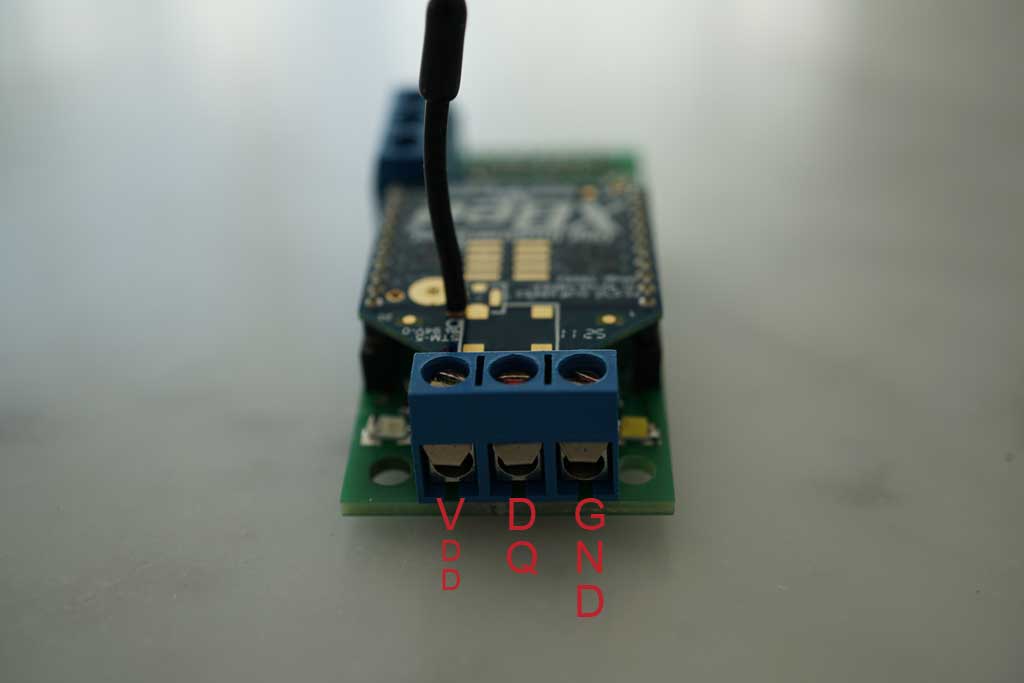
The 1-wire XBee Base station module offers you two possibilities to connect 1-wire sensors to the Raspberry Pi base station directly. The following pictures show you how to connect them using a a small screw driver. Left: + Voltage; Center: Signal; Right: Ground
The sensor cables can be mounted when the module is already mounted to the RasPi. We recommend to use the 1-wire side port as it's located next to the cable relief mounting. Picture below: Side view - without an XBee radio
Picture below: Front view - with mounted XBee radio
Privacy & Passwords
We take privacy seriously and wish you do the same. It is therefore imperative, that you change all the default passwords.
TMOR system
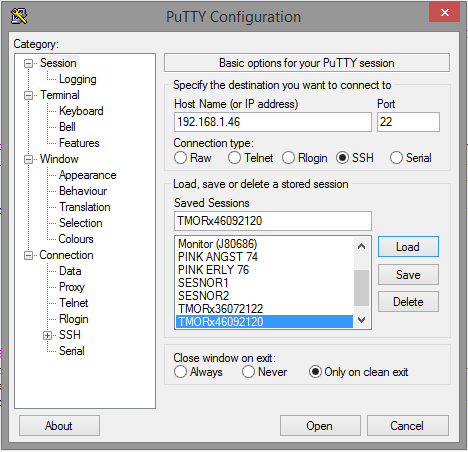
Use putty or another remote shell program to connect to your TMOR base station. We use putty and the configuration looks like this.
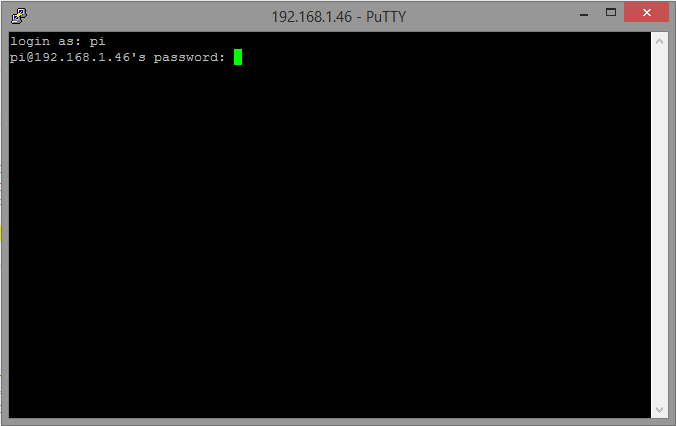
Once successfully connected to TOMR the following screen prompts you for user and password.
user: pi
password: raspberry
A successful login looks like this.
Type sudo raspi-config to enter the configuration menu of the Raspberry Pi. Choose Change User Password from the menu. Do not forget to note down your new password.
Web Server
A great deal of user interaction is conducted via the TMOR Base station web portal. This portal is driven by the Apache Tomcat web server. The following steps explain how to change the admin password there:
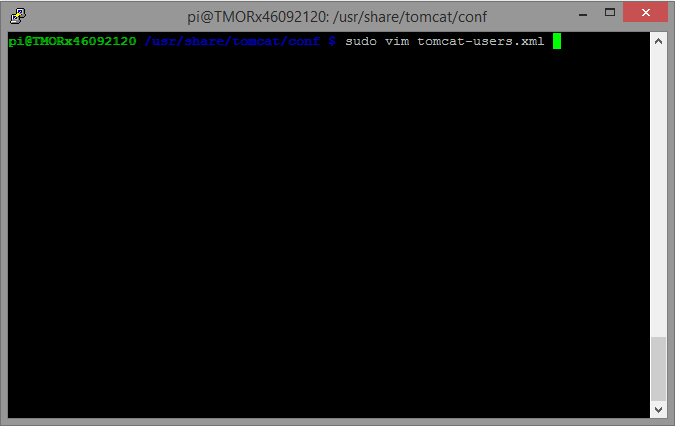
Use putty and connect to your TMOR box. Change to the directory holding the admin password by typing cd /usr/share/tomcat/conf/.
Use the preinstalled vim text editor (or nano ) to open the password file by typing sudo vim tomcat-users.xml. This should look like this.
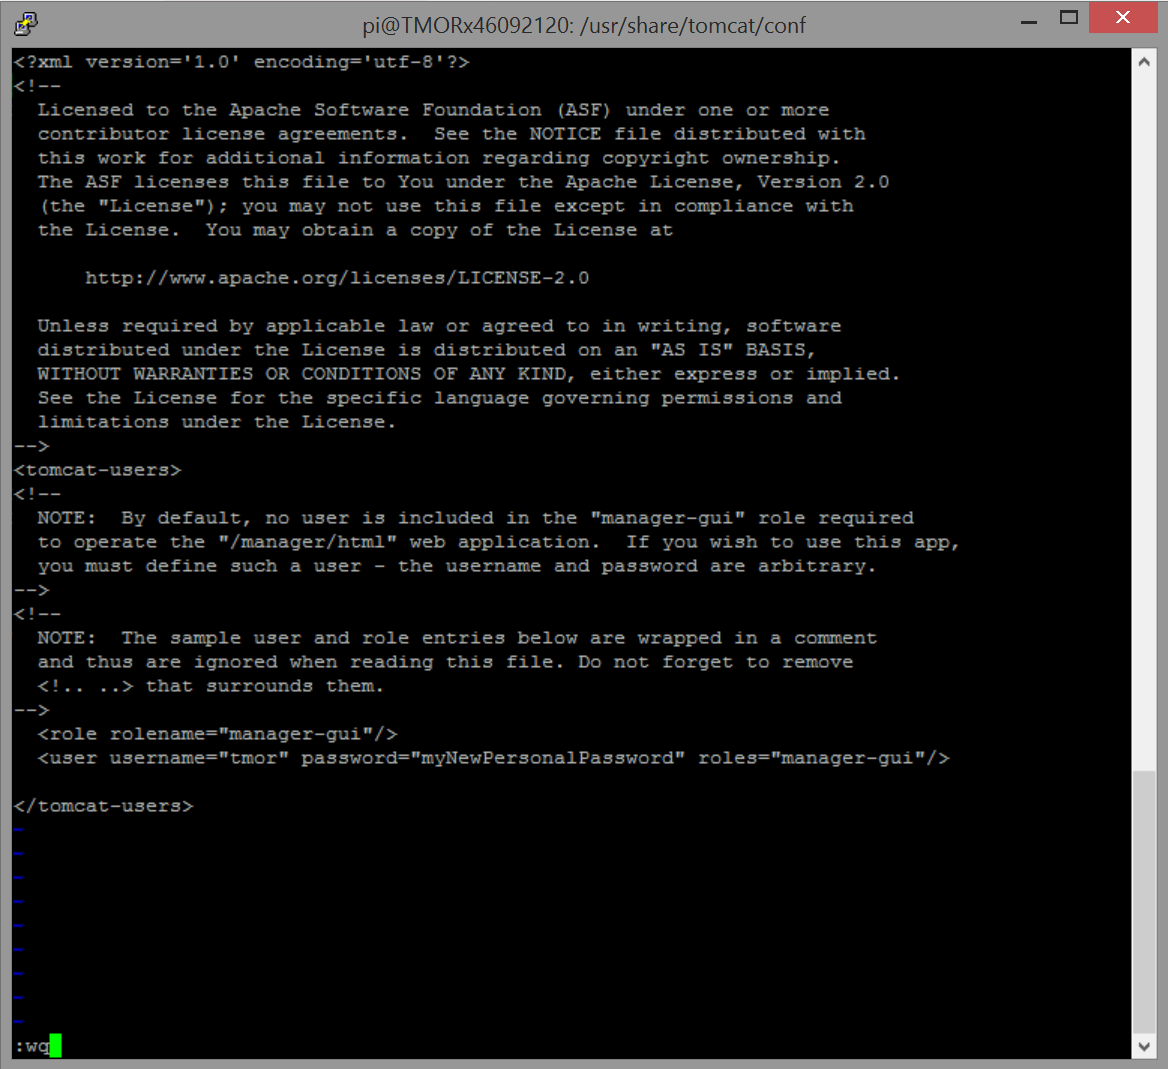
The file has the following content. Use the arrow keys and move the green cursor to the text line <user username="tmor" password="tmor1234567890admin" roles="manager-gui"/>. Press the i key to change the mode of the vim to insert. This is editor displayed in the status bar of the vim as shown here .
Modify the default password tmor1234567890admin to your new password. You also can change the default user tmor to a user which suits you more. However pay attention, that you do not erase the pre- and trailing " double quotes.
It should look somehow like this . Now safe your changes by pressing the ESC Key to change from inser mode to command mode. Then safe the file by pressing : followed by w followed by q key. The text editor shows shows this in the status bar. Now press the enter key and the file is saved.
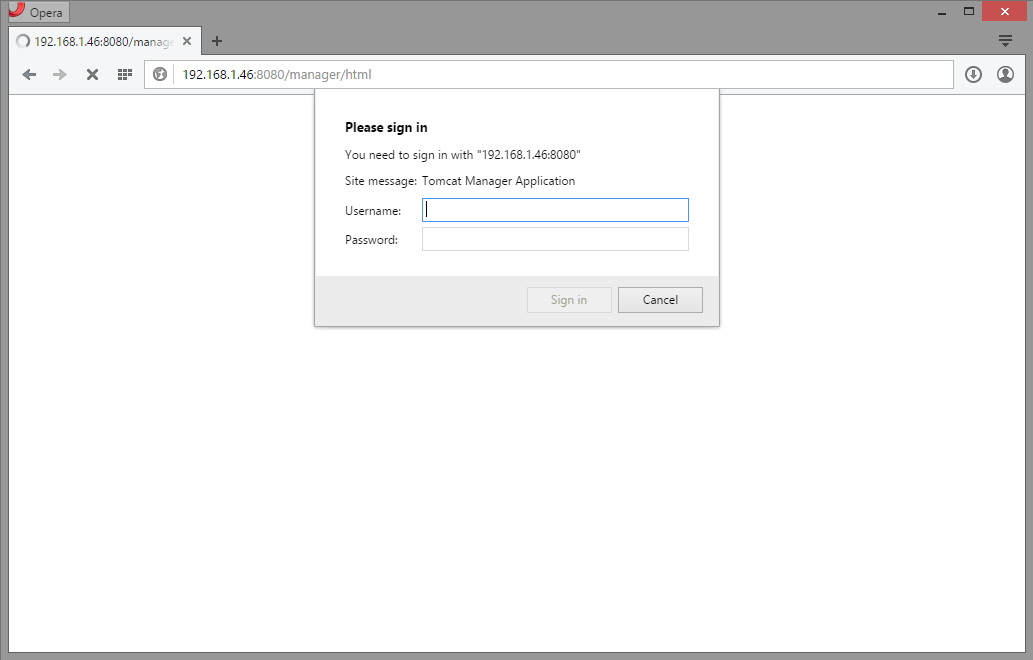
For the password changes to take effect you need to reboot the system. Type into the console sudo reboot now. The TMOR system goes down and starts up again. Once the system is up again try to access the Webserver Administration Page by typing the following URL http://{YOUR ID ADDRESS}:8080/manager/html into the web browser. You should be asked for a user and password to access this page. Enter your newly changed user and password as shown here.
Database Server
These are the default MySQL database users with their passwords. We strongly recommend to change those or at least to block the remote access to the data base via port 3306.
MySQL admin:
The MySQL database server can remotely be accessed via the default port 3306. This feature can be disabled as described here.
The default passwords are:
MySQL user: root Password: BL$4JaxfyBox#3
MySQL user: tmor Password: cUg5E30Tlx2143vOosAsdTgGr09
In oder to secure your MySql database from unauthorized access we reccomend to changing the password for the tmor user in the following way:
1. On the RasPi console log into the MySql by typing mysql -u root -p.
2. Select a new password for the tmor user and note this password down. In this example its hereIsYourNewPassWord.
3. Once you are logged into the MySql system type:
UPDATE mysql.user SET Password = PASSWORD('hereIsYourNewPassWord') WHERE User = 'tmor' AND Host = 'localhost';
FLUSH PRIVILEGES;
UPDATE mysql.user SET Password = PASSWORD('hereIsYourNewPassWord') WHERE User = 'tmor' AND Host = '%';
FLUSH PRIVILEGES;
The database server password change requires a change in the tmor configuration.
4. Open the file /usr/share/tomcat/lib/tmor-hibernate-external.cfg.xml and
move to line stating connection.pasword.
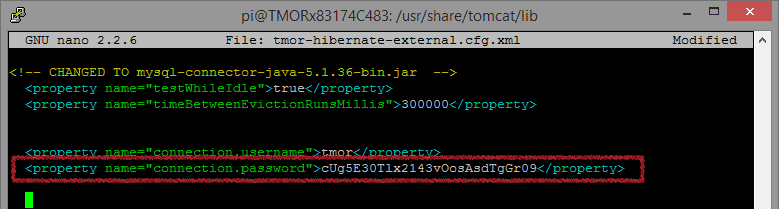
Change the current password cUg5E30Tlx2143vOosAsdTgGr09 with the newly assigned MySql database password.
Save the file.
5. Reboot the RasPi by typing sudo reboot now.
6. Once the TMOR system is up and running again check whether the change was successful by accesing the TMOR web page.
User of 3rd party FTP server connection
TMOR offers the possibilty to share TMOR data with a remote 3rd party web server via SFTP. In order to connect to the 3rd party webserver,
a user with a password needs to be stored on the TMOR base station. We reccomend to define a new user with restricted rights on
the 3rd party remote system. On TMOR side, the password will be encrypted and stored in the TMOR data base. The encryption of the remote user password is done via
a secret algorythm, which itself needs a password. This password is stored in tmor.properties under key masterpassword and should be changed, in case
an attacker obtains access to the TMOR base station database.
In your network
TMOR is preconfigured to obtain an IP address from your Gateway / Router / DHPC server.
The file /etc/hostname holds the name of your TMOR Base station. You can look up and perhaps change the preconfigured name by typing sudo vim /etc/hostname.
The best way to figure out which IP your TMOR Base station has is to look up your Gateway / Router / DHPC server for this. The Entry should look like TMORxYYYYYYYY PI ADDRESS as shown here.
The file /etc/hostname holds the name of your TMOR Base station.
Having a dynamic IP address can be hazardous as when the IP address changes you need to look up the new address as described above. Another way is to assign a fixed address on your TMOR base station. This also permits to configure your network as you like. Good descriptions can be found here, here and here.
Once you know TMOR's IP address you can access the user web interface URL: http://{IP ADDESS}:8080/TMOR/Index. The web page that opens should look similar to this one.
If you can not reach the web page check chapter "Can't connect to TOMR Base station web page" in the troubleshooting section.
Customizing TMOR
The TMOR properties file /usr/share/tomcat/lib/tmor.properties offers the possibility to adapt TMOR to your personal needs.
The only thing needed is a text editor such as vi / vim and a reboot. Changes only get active after you restarted the TMOR Base station.
The default values in the properties file guarantee a maximum on stability and speed but some functionality will not work as it needs your private information such as email server credentials for the messaging.
Be also aware that wrong values can prohibit TMOR from working properly. The logfiles will help locate the problem in case of misconfiguration.
#docroot.win=E\:\\WORKSPACE\\eclipse_20120417\\.metadata\\.plugins\\org.eclipse.wst.server.core\\tmp0\\wtpwebapps\\TMOR\\
docroot.win=C\:\\WORKSPACE\\sensors_20130520\\.metadata\\.plugins\\org.eclipse.wst.server.core\\tmp3\\wtpwebapps\\TMOR\\
docroot.unix=/usr/share/tomcat/webapps/TMOR/
This is the direcotry of the HTML and JSON files. Do not change this value.
# VALUE IN MINUTES
pusheventdisplaywindowtime = 30
30 is the timespan in minutes where a push event will be seen on the Index page. #todo
#TIMEZONE - according to http://stackoverflow.com/questions/1694885/timezones-in-java
timezone=Europe/Brussels
Make sure to enter here the right time zone. A list of available time zones can be found here.
# URL TO KICK PULL BRICK C CODE
urlcallpullbricks = http://192.168.1.11/cgi-bin/processbrickid.cgi?param1=
#todo delete not used anymore
# DIRECTORIES FOR FILETRIGGER BRICK VALUES
filetrigger.dir.frombrick.win=c\:\\temp\\sensors\\filetrigger\\frombrick\\
filetrigger.dir.frombrick.unix=/var/tmp/sensors/filetrigger/frombrick/
filetrigger.dir.tobrick.win=c\:\\temp\\sensors\\filetrigger\\tobrick\\
filetrigger.dir.tobrick.unix=/var/tmp/sensors/filetrigger/tobrick/
filetrigger.dir.tobrickprocessed.win=c\:\\temp\\sensors\\filetrigger\\tobrick-processed\\
filetrigger.dir.tobrickprocessed.unix=/var/tmp/sensors/filetrigger/tobrick-processed/
filetrigger.dir.brickconfig.win=c\:\\temp\\sensors\\filetrigger\\brickconfig\\
filetrigger.dir.brickconfig.unix=/var/tmp/sensors/filetrigger/brickconfig/
File location fo the communication between TMOR Batch module and Serial module. Do not change these values.
# DIRECTORIES FOR THE PICTURE UPLOAD ANd STORAGE
pic.dir.win=c\:\\temp\\sensors\\pics
pic.dir.unix=/usr/share/xbee/pics
File location fo the uploaded pictures. Do not change these values.
#simulate the pull brick values
simulate.pullbricks=false
#todo delete not used anymore
File location fo the uploaded pictures. Do not change these values.
# TIMEWINDOW FORM PULL BRICK MINMAXDATA VALUE IN days
pullbrickdailystatistics = 370
Time limitation for statistical analysis in days - e.g. how many days of data collection to we take into account? This value needs to be positive.
# SHALL ON STARTUP / REDEPLOY OF WAR THE JSON FILES FOR THE PULL BRICKS BE NEWLY CALCULATED [YES | NO]
preloadpullbrickjsonfiles = YES
With a YES the JSON files are generated when the TMOR Base station is restarted. A NO increases the startup process.
# How many lastactions shall be shown on the index page
lastactionslistlength = 10
If actions have been defined, then the IndexJSP page dsplays the last {lastactionslistlength} actions. This value needs to be positive.
#COM PORT - UART
comport.win=COM11
comport.unix=/dev/ttyAMA0
It's the address of the physical serial port. The Serial module needs this information to communicate with the XBee Radio network.
#XBEE LOG4J PROPERTIESFILE
log4jxbeeconfig.win=log4jxbee.properties
log4jxbeeconfig.unix=/usr/share/tomcat/lib/log4jxbee.properties
Location of the log file for the Serial module. To not change this value.
#DIRECTORY OF DS18B20
pi.temperaturesensor.root.dir.unix=/sys/bus/w1/devices
pi.temperaturesensor.root.dir.win=makes_no_sense
File directory of the 1-wire temperature sensor. Do not change this value.
#DATA DOWNLOAD FILES LOCATION
downloaddata.foldername=download
HTTP folder where all the pictures are accessible. Do not change this value.
#email send server configuration - hotmail - yahoo - and own smtp server
email.sendvia.hotmail.user.name=myOwnEmailAddress@hotmail.com
email.sendvia.hotmail.user.passwd=SomeSecretPassWord
email.sendvia.hotmail.port=25
email.sendvia.hotmail.port.secured=587
email.sendvia.hotmail.host=smtp.live.com
email.sendvia.yahoo.user.name=myOwnEmailAddress@yahoo.com
email.sendvia.yahoo.user.passwd=SomeVerySecretPassWord
email.sendvia.yahoo.port=25
email.sendvia.yahoo.port.secured=587
email.sendvia.yahoo.host=smtp.mail.yahoo.com
email.sendvia.own1.user.name=
email.sendvia.own1.user.emailaddress=
email.sendvia.own1.user.passwd=
email.sendvia.own1.port=
email.sendvia.own1.port.secured=
email.sendvia.own1.host=
email.sendvia.own2.user.name=
email.sendvia.own2.user.emailaddress=
email.sendvia.own2.user.passwd=
email.sendvia.own2.port=
email.sendvia.own2.port.secured=
email.sendvia.own2.host=
Enter here the mail server credentials so that notifications via email can reach you. The best way is to setup a new free email account with Yahoo and Hotmail.
You also can use your own email server by entering the data in the keys own1.user.name etc. However, this feature is hardly tested as we don't know your email server communication settings.
TMOR first uses Yahoo, then Hotmail then own1 and last own2 configuration.
# PERFORMANCE CONFIGURATION FOR INDEX PAGE
jspindex.stackchart.datapoints.daysback=100
jspindex.stackchart.datapoints.datacounttarget=5000
The IndexJSP page provides the user with a bar chart showing the data producers and their data collected. This operation is very time intensive and can greatly impact the users TMOR web interface experience.
daysback limits the number of days we look back to count the data points collect whereas the field datacounttarget limits the points to around a certain number. By increasing this number the user wait time will be increased too.
# How many last values shall be shown on the values page
jspvalues.bricklatestXvaluesList.listlength = 1000
jspvalues.jsonlastXBrickValues.listlength = 1000
jspvalues.histogram.continuous.datacount.recalc.treshhold = 5000
It's the address of the physical serial port. The Serial module needs this information to communicate with the XBee Radio network.
#BATCH CONFIGURATION - CHANGES NEED A RESTART OF THE SERVER
#0/50 * * * * ? --- TIMESLIDE PUSH VALUES IN INDEX PAGE
batch.update_push_brickvalues.cronexpression=0/50 * * * * ?
The push value charts are updated on regular basis. Here it is all 50 seconds. The format is a cron expression. The more often the charts are updated the less time has the TMOR Base station for other tasks. Make sure to enter a cron conform expression.
#0 34 02 ? * *  --- HISTORICAL DATA - DO HAVE UPDATED PRECENTILE CHARTS
batch.update_calc_histor_data.cronexpression=0 02 13 ? * *
The calculation of the historical data is done once at night (here 2:13 am). The format is a cron expression. Historical data is on a daily basis so it makes no sense to calculate it several times a day. Calculate it instead shortly after midnight to have the data available in the morning.
# MASTER PASSWORD FOR ENCRYPTION OF SENSITIVE DATA
masterpassword=Wh3nTH1sPasswordChandedEncryptedDataNeedsTOBeReset
#HOSTNAME AND IP ADDRESS LOG FILE system_ip_hostname.log
systemiphostnamestatusfile.dir.win=C\:\\WORKSPACE\\tmor_20171004_v3\\.metadata\\.plugins\\org.eclipse.wst.server.core\\tmp0\\logs
systemiphostnamestatusfile.dir.unix=/usr/share/tomcat/logs

#TWEET CHANGE IN NETWORK PROPERITES - VALUE 0=no tweet, 1=tweet when change in properties 2=like 1 and when system comes up
systemiphostnamestatus.tweet=0
With TMOR release V3.1.0 the base station can broadcast its own ip address. This is valuable when running TMOR in a network under a dynamic ip address. Changes in the ip address are
recorded in a separate logfile. The location is specified under systemiphostnamestatusfile.dir and is name system_ip_hostname.log. Changes can be broadcasted via twitter, when the
value of key systemiphostnamestatus.tweet is 1 or 2. On 2, it twitters each change in ip address. On 1, it twitters only when the base station starts up. Value 0 disables the
messaging via twitter. On all 3 levels the changes are recorded in the log file system_ip_hostname.log.
#XBEE STATUS LOG FILE
xbeestatusfiles.dir.win=c\:\\temp
xbeestatusfiles.dir.unix=/usr/share/xbee
xbeeconnectionattempts=10
Applies only to Raspberrry version 3. Sometimes, Raspberry version 3 has jitters on the serial port and therefore can't connect to the XBEE radio module on the base station (coordinator).
A reboot can solve this problem. Parameter xbeeconnectionattempts specifies how many times the system is rebooted in case no connection to the coordinator can be established.
The parameter xbeestatusfiles specifies where the Raspi v3 / XBEE communication status log file is located. This log file holds all connection attempts (failures and successes).
This flowchart shows the behavior graphically.
Using XBee Radio
In order to use the XBee Radio function, the XBee modules must be configured correctly. Digi provides XCTU , a programming tool for the XBee Series 2 Radio modules which are used with TMOR. Important is foremost, that the following serial configuration is set:
- Baud rate: 9600
- Parity: No Parity Bit
- Stop Bits: 1
- API Mode: 2 (with escaping)
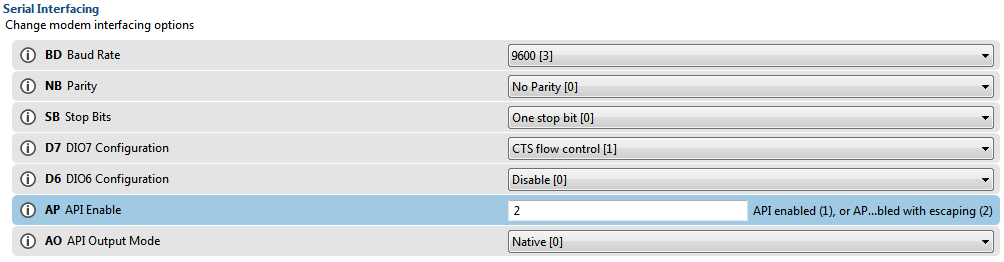
The following XCTU profile holds the whole coordinator setup.
Note: This applies to Raspi V3 users only: Raspi V3 shares the serial port with the bluetooth device. Due to this, the frequency of the serial port is not constant.
This results in miss-communication between the XBEE coordinator and the raspberry version 3. A workaround is a reboot, in case the raspberry 3 cannot find the
coordinator. A reboot is performed automatically unless the XBEE radio module can be accessed or the maximum number of communication tries exceeds the number of tries, which is
by default 10 times . After that the flag file xbee_status_connected is written into the directory /usr/sahre/xbee.
The following flow diagram depicts this behavior.
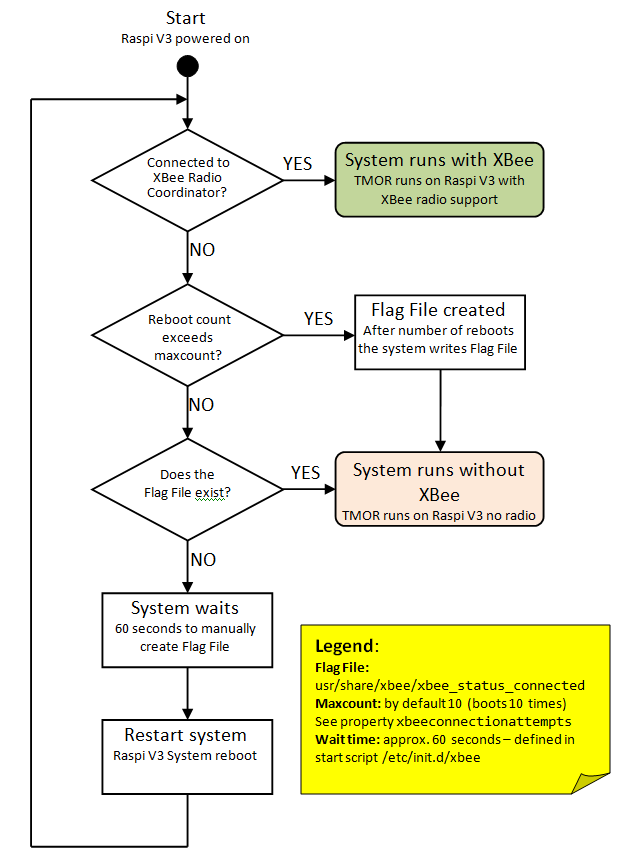
From TMOR version 3.1.0 on, the flag file xbee_status_connected exists, and no reboot is performed. This speeds up the boot phase.
In case the XBEE radio is used, the xbee_status_connected file should be deleted. However, expand the filesystem before removing the flag file, as a reboot during file system resizing can damage the SD card . This reboot behavior applies only to Raspi V3. The older Raspberry version 2 (Wheezy image) and Asus Thinker (Linaro image) are exempt from this behaviour.
Manual Dashboard
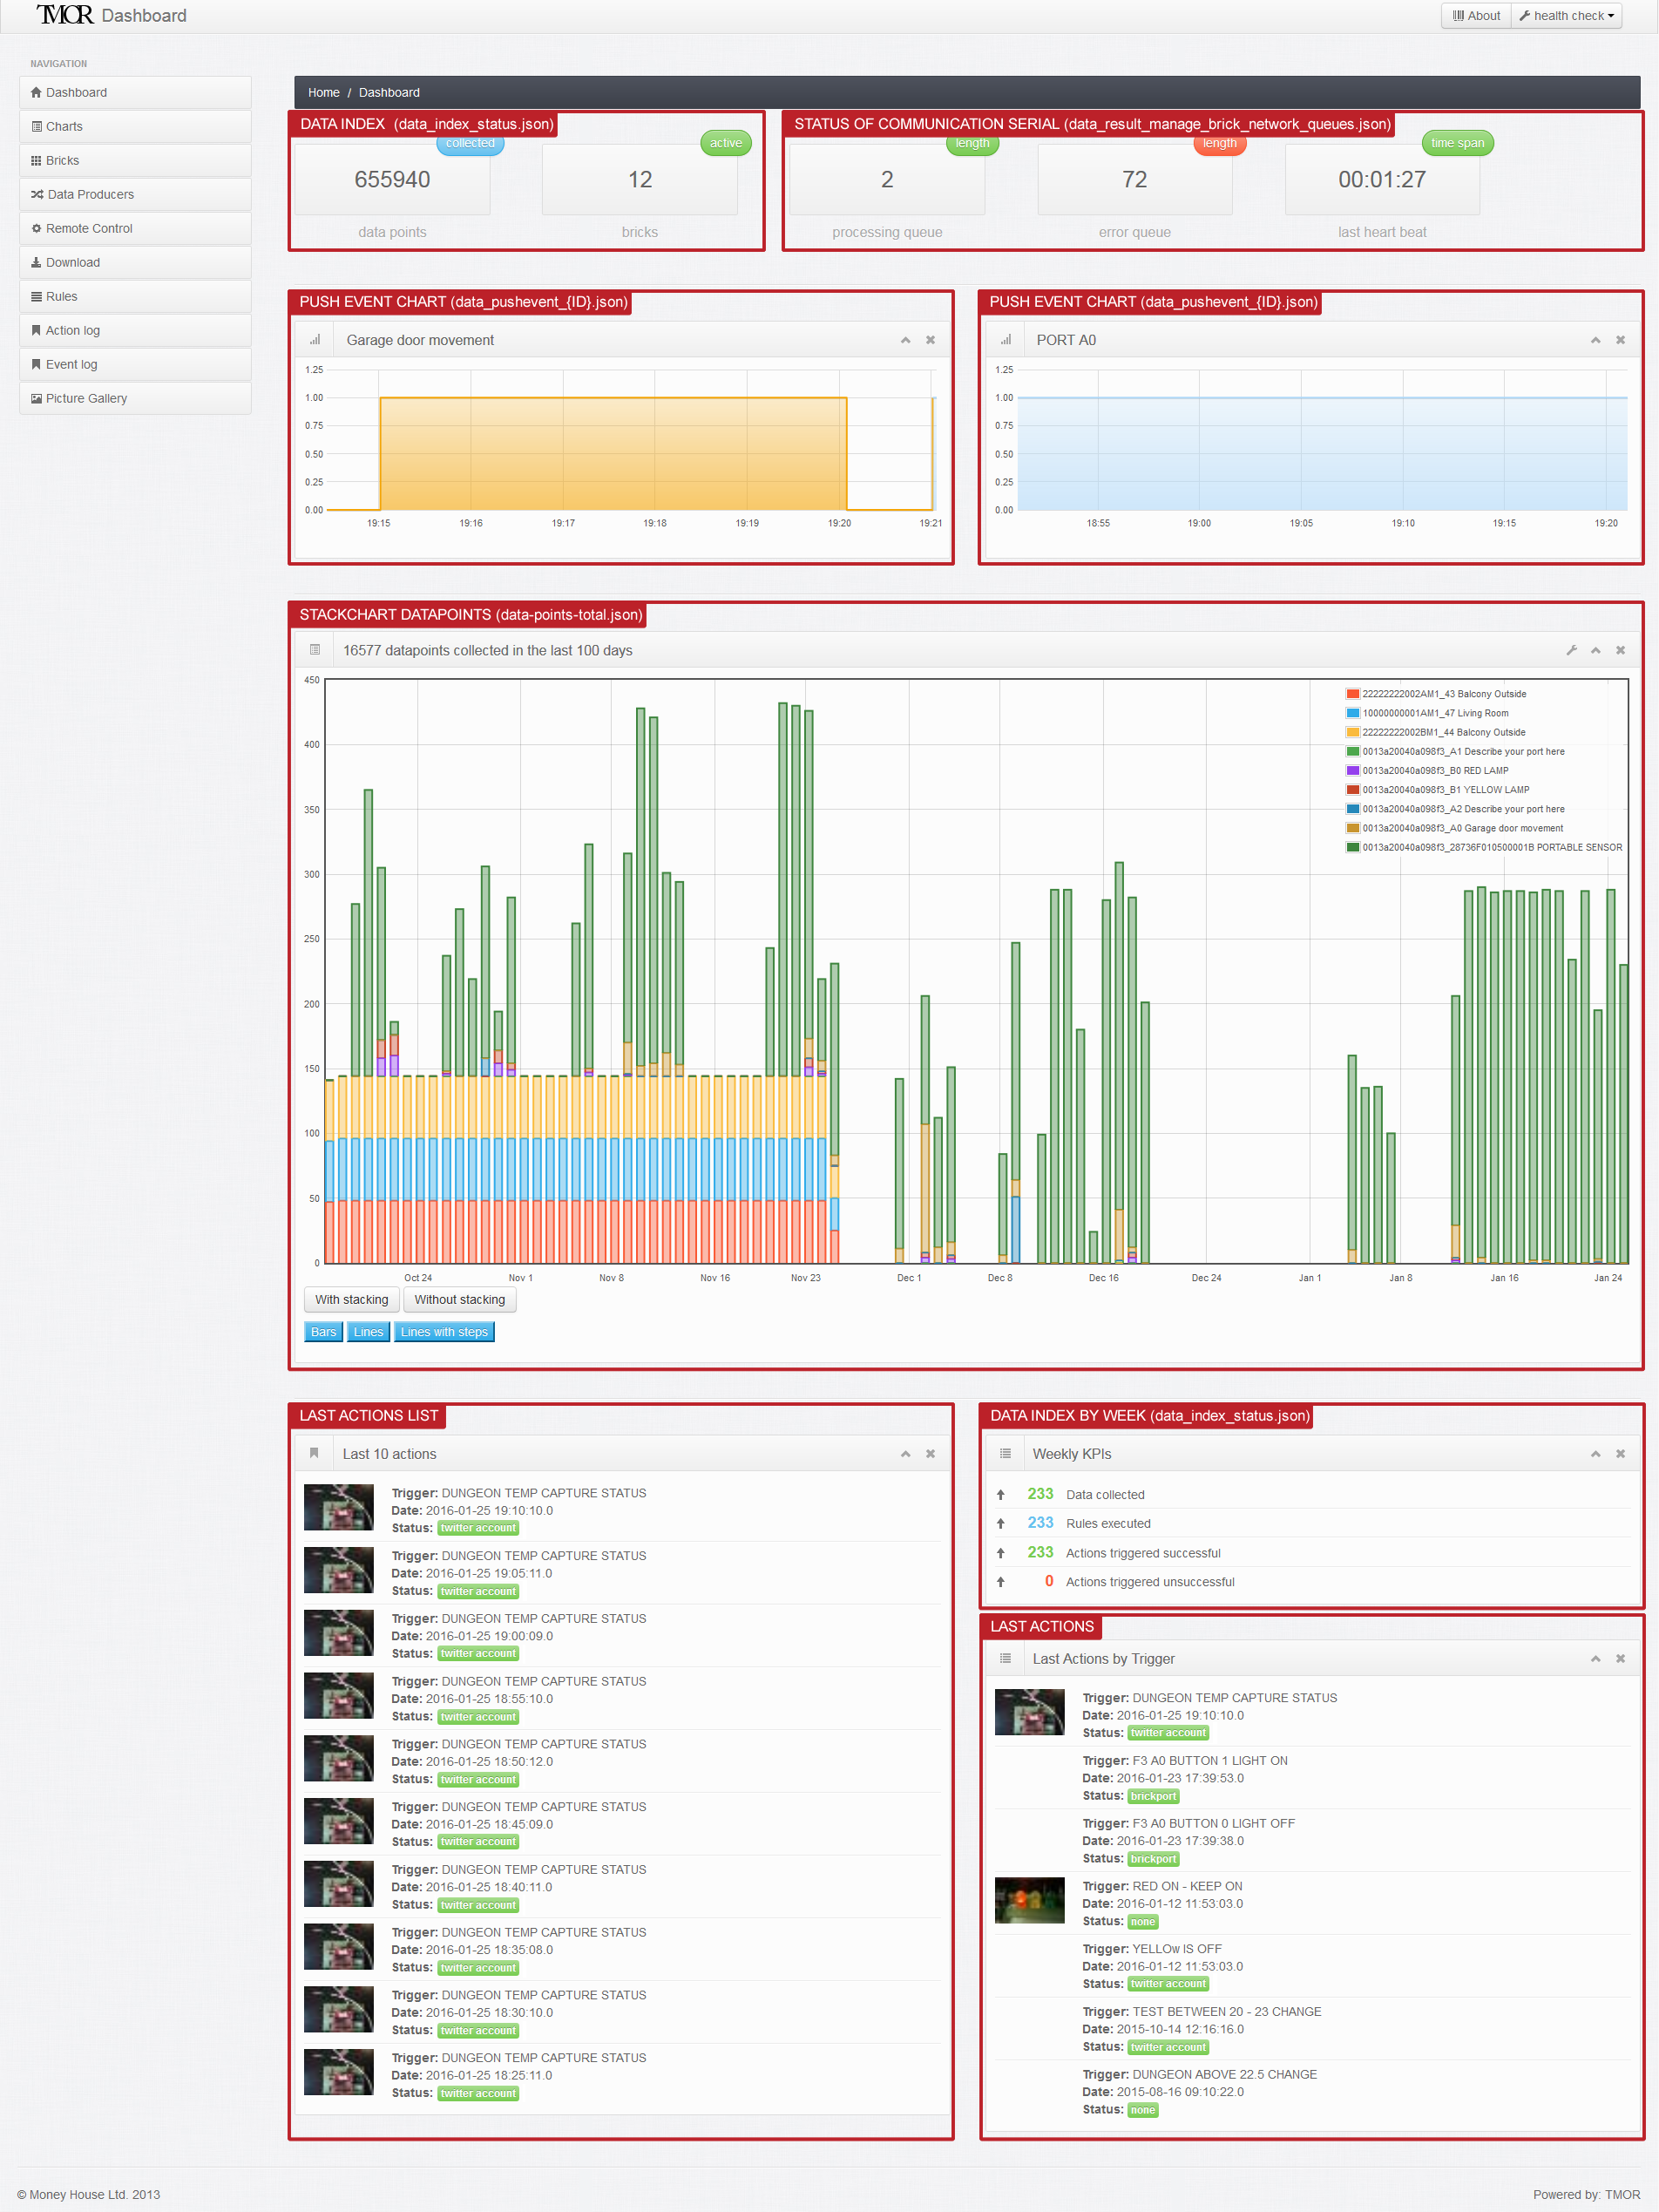
The Dashbord aka Index page provides all the important information at one glance. The top row displays the status of the whole operation as it is at the moment:
- Data points counter shows the amount of data collected until now
- Bricks counter shows how many bricks are active. Only data from active bricks are stored in the database
- The processing queue counter tells you how many requests are pending - what to do when it increases constantly
- The error queue counter shows how many requests where not processed - it only keeps the last 2 hours
- The heartbeat elapsed time message shown that all modules are working together - all 2 minutes a new heartbeat is sent out
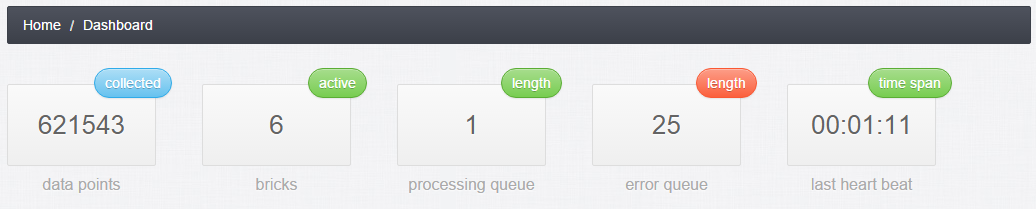
This row gives you an idea how good TMOR runs right now at the moment. In order to prevent an overflow of the system, the file system is cleaned of messages that are older than 2 hours. A good indication for malfunctioning is therefore a relentlessly increasing processing queue and error queue counter. The troubleshooting section explains how to deal in those situations.
The second row from the top is optional and only appears, when push bricks are activated. The screenshot excerpt below shows that in this configuration two push sensors/ports are activated.
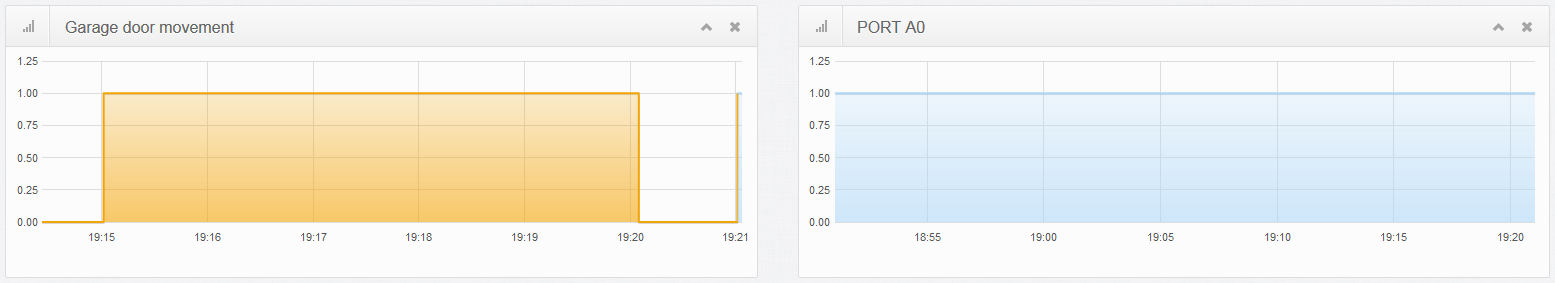
All push sensors transmit their captured values directly into the running graph. The preset time window of the graph is 30 min. Values captured within the last 30 minutes are shown in yellow, whereas older values are displayed in blue. So for example did PORT A0 on the right hand side not change value in the last 30 minutes and therefore the chart is all blue.
In contrast, some movement got registered at the Garage door, which is displayed graphically on the left hand side.
These charts are updated all 50 seconds by default. Those data rolling charts are fed by
json files with the naming data_pushevent_{id}.json. The limitation of this chart type is, that only the last 20 datapoints are graphically displayed.
The third row, displays a bar chart with the data count for each data source.
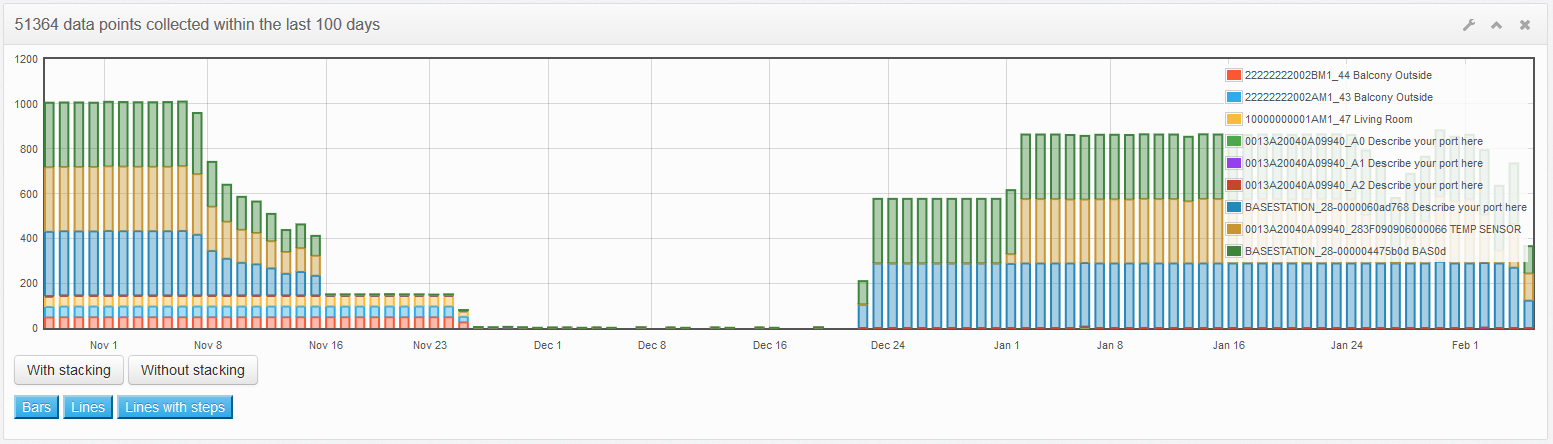
By default data is shown in a stacked way, showing each day's total of the collected data. The chart height is by default 300 pixels, which sometimes is not enough
(like in this case where the legend covers the last couple of days). By clicking the little (top right)
the chart height can be changed within the range of 50 to 900 pixels.
Note: Calculating this chart is system intensive. Therefore calculation of the past 100 days is done some 2 hours after midnight by default.
By running this task at night you increase your user experience as you don't have to share limited resources with a back gourd process.
So don't forget to set the time zone correctly when being outside of Europe.
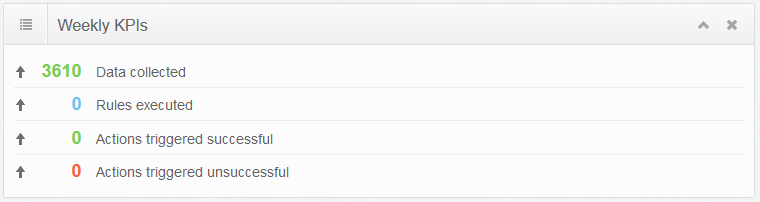
At the bottom of the Index page you can see which rules and actions were triggered by the collected data. The KPI (key performance index)
counters show the resulting activities on a weekly basis. From Sunday to Monday at midnight the counters are reset.
A rule can be defined upon certain criteria. Those rules can trigger actions, such as email sending, twittering or being silent.
When to a triggered rule cannot send an email, then the counter Actions triggered unsuccessful is incremented.
When the email or tweet was sent out successfully then the Actions triggered successful counter is incremented.
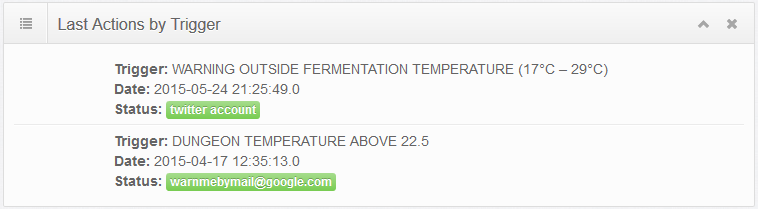
Last Action by Trigger shows which rules got triggered last - even when it is years back. In this way you see which rules have an impact on your data collection.
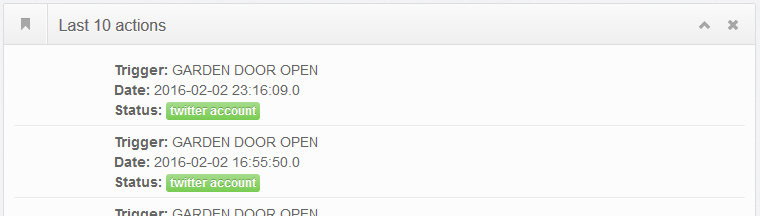
A chronological order of all the actions that have been triggered is also shown in at the bottom of the index page. The length of the last actions list can be modified here.
The following screenshot of the entire Index page gives you an idea which data is provided in which way (either embedded in HTML or as JSON file). This might be of importance, when you want to build upon TMOR your own data processing.

Manual Charts
With TMOR your get various charts out of the box. All time series based charts can be found under Chart page.
Percentile daily charts
The first set of charts are percentile charts on the daily bases. All the values collected within 24 hours of the same day are sorted in an ascending way. The chart marks the following values:
- Minimum value (MIN)
- 20% value
- 40% value
- Average
- 60% value
- 80% value
- Maximum value (MAX)
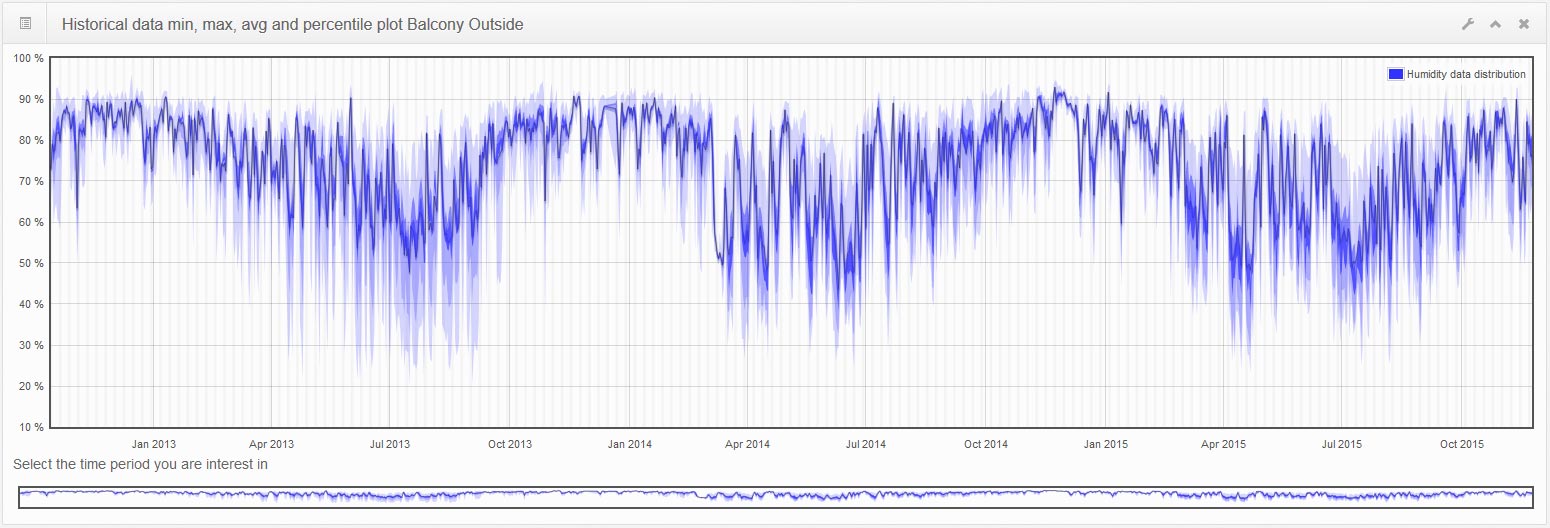
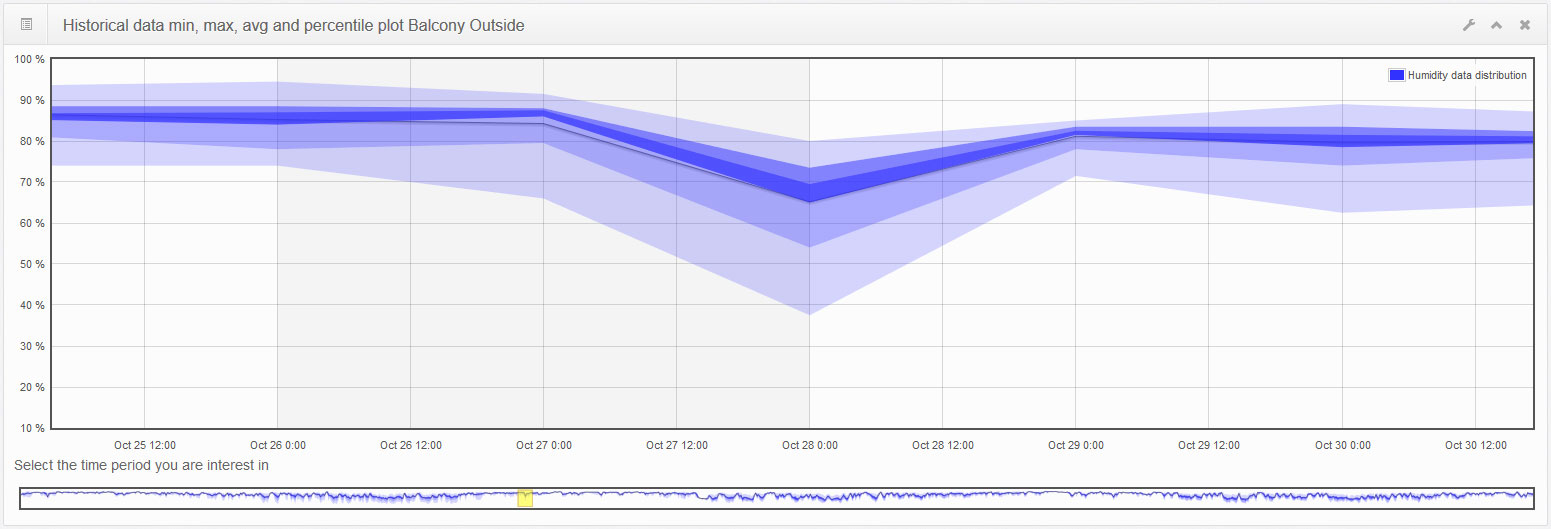
The percentile charts are zoom able. By using the mouse to select a time range in the chart one can zoom into the chart and get more detail - as shown below where we zoom into the time from October 26th 2013 up to the 30th October 2013. Note: This feature does not work on iPad and similar devices.
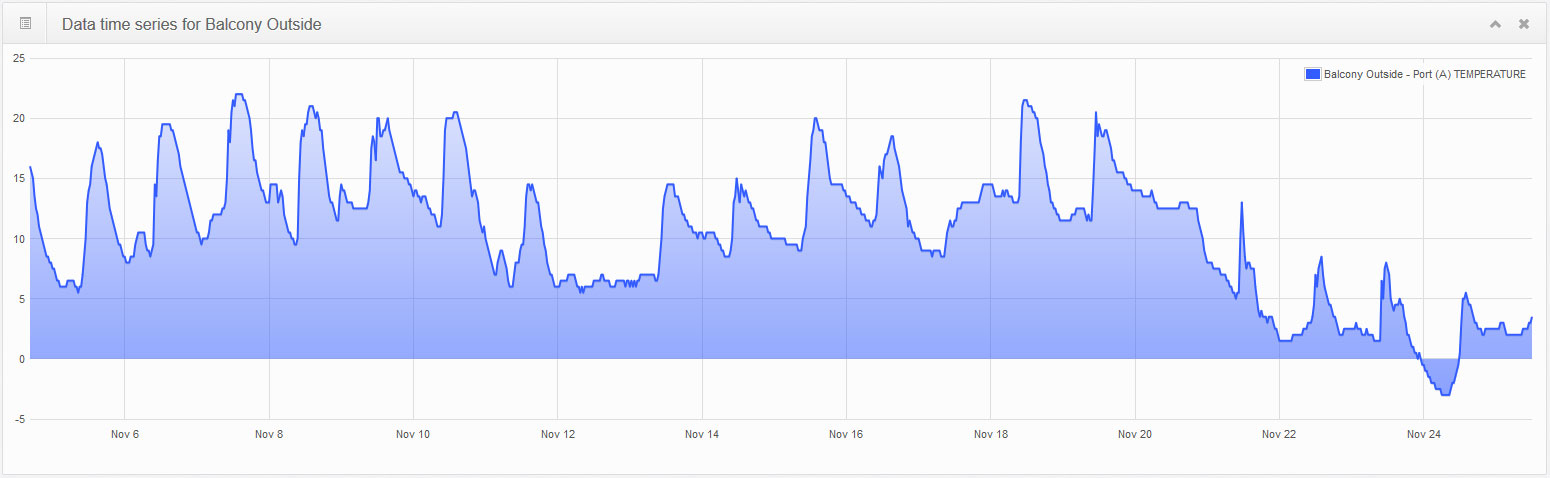
Raw data time series chart
Raw data, as it is collected and stored, is shown in the following chart. As the data amount can grow quite quickly (up to 720 data points per 24 hours), there is a restriction on the amount of data that is displayed in this type of chart. This has to do with striking the right balance between user experience and amount of displayed data. In case you don't mind to wait a little bit longer for the Chart page to build up, you can increase the number of data points shown in the Data time series chart by changing the parameter jspvalues.bricklatestXvaluesList.listlength. This chart is identical with the time series chart in the Values page.
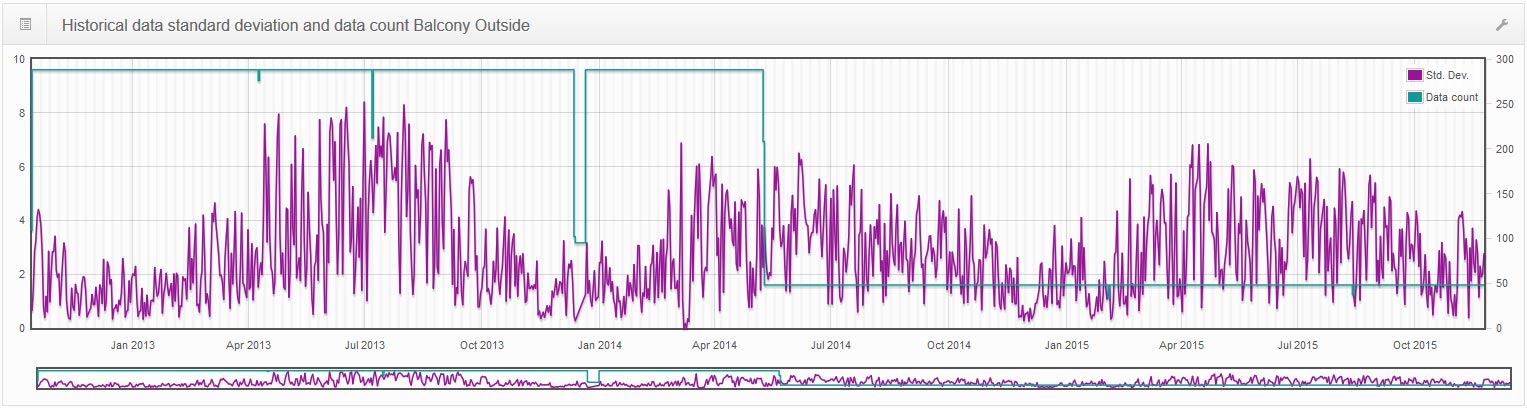
Further information on historical data - data count and standard deviation
The percentile charts rely on refined data, which in turn are stored separately in the data base.
To obtain confidence on your statistical analysis it is important to know how many data points are available and how it varies.
These two information can be obtained in the following chart. Combining this chart with the percentile charts
carry your analysis further, permitting you to gain deeper insights.
This type of chart is also zoomable. The left y-axis displays the Standard deviation.
The right y-axis marks the data counts. By zooming in on the 9th March 2014, on can
see, that the collection slowed down from 288 points/day to 48 points/day.
In other words was the 5 min sampling intervall replaced by a 30 min sampling interval.
Manual Bricks
Access the Bricks page to display your entire TMOR network. This page is divided into 3 main sections which are subsequently dealt with.
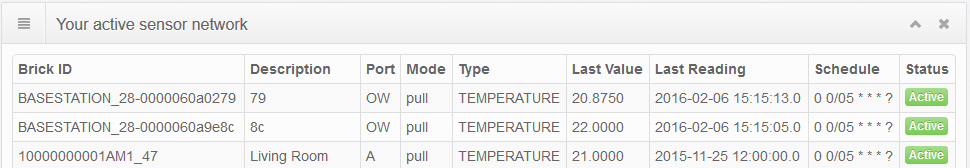
Top section - Your active sensor network
The top sections holds a list of your active sensors and ports. Here you see immediately which data producer delivered which value when. This list is sorted by the Last Reading date column. Next to the Last Reading column is the Last Value column,
displaying the value collected and stored in the data base.
By clicking on this Value one gains access to the Values page, which provides in dept information about this sensor or port.
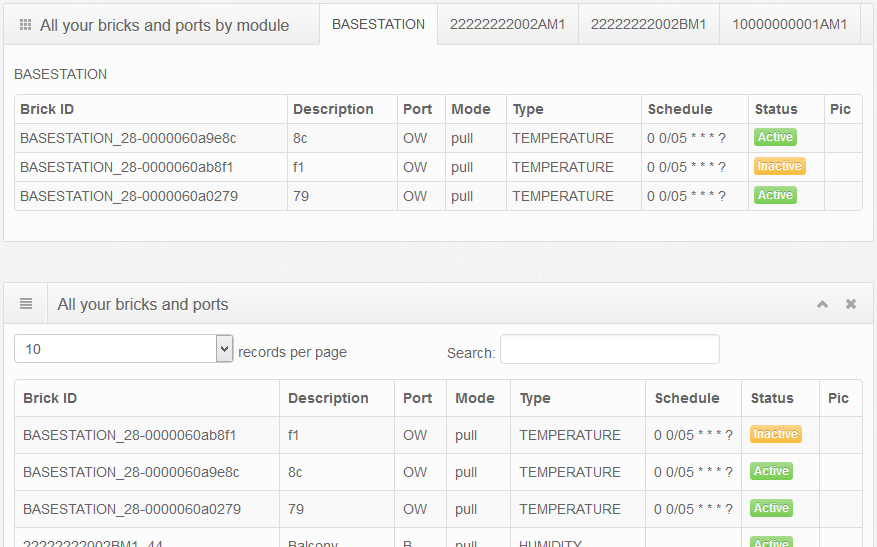
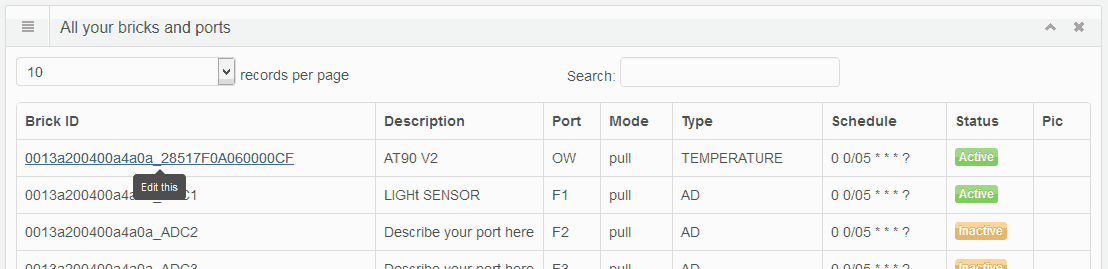
Middle section - All your bricks and ports (by module)
All your Bricks with the sensors and ports are listed here (either by module, or as plain list), independently of their status as shown below.
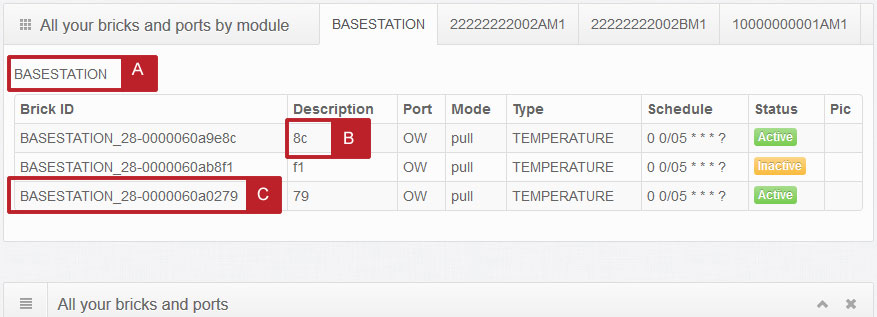
Changes and updates on existing bricks can be made as follows:
- When clicking on the Brick name as indicated below under point A, then changes of (newly added or removed) sensors / ports to the selected Brick are detected. This animation shown how to add a newly connected sensor to the TMOR data base.
- When changes to the configuration of a sensor / port need to be made, then clicking on the Description field as shown in B lead to the configuration window.
- When a general setup of a sensor / port is necessary, then click on the Brick Id as marked below in screen shot under point C.
Note, that this page gets it data directly from the data base. In order to see the changes on ports / sensors and current values a page reload must be performed.
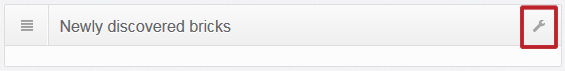
Newly discovered bricks
This page displays the data entries on the data base. However, sometimes you want to add a new Brick to the XBee radio network. After you have powered up the new Brick, the TMOR base station needs to scan the network for this new Brick in order to register this new Brick in the TMOR data base. The searching and adding of a new Brick is done in the lowest part of the Bricks page. Just click on the symbol on the top right of theNewly discovered bricks window, which by now should still be empty.
This opens a modal window, which kicks off the scanning of the network once you pressed the Start scan button.
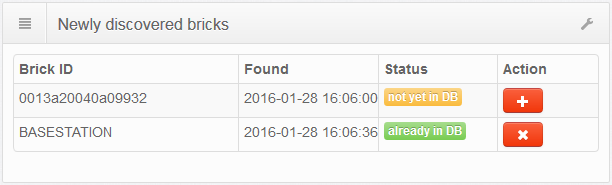
This process lasts approx. 2 to 3 minutes. At the end of the scan the Show result button appears which initiates the page reload providing the scan result.
As the below depicted screenshot shows, a new Brick with the ID 0013a20040a09932 was found in the
TMOR network besides the existing Base station. By clicking the + PLUS button in
Action this newly found Brick will be entered into the data base. Once the newly discovered Brick is in the data base the procedure
Changes and updates on existing bricks explains how to configure the sensors / ports attached to it.
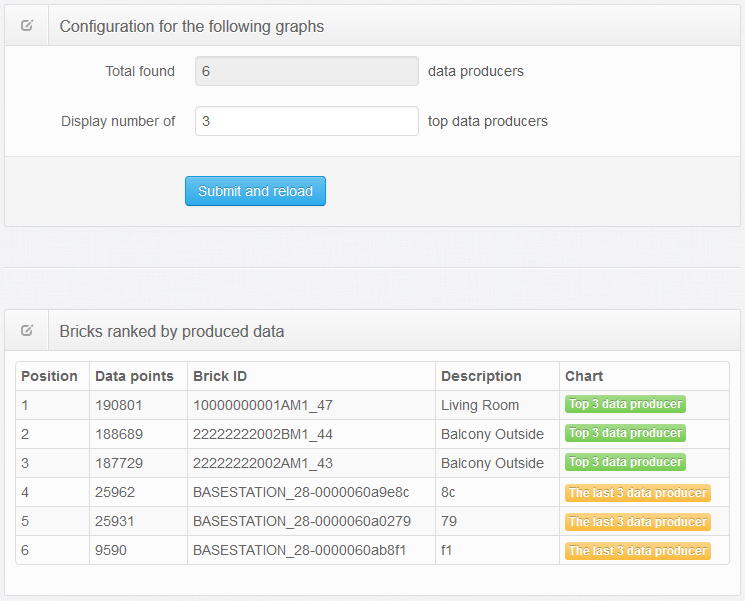
Manual Data producers
The page Data Producers is an extended version of the Data count bar chart
on the Index page. It shown all the data producers since the first data recording, and as there might be
many different data sources, it lets you sort according to
data volume produced. The screenshot below shows, that the top three data sources are in one graph e.g.
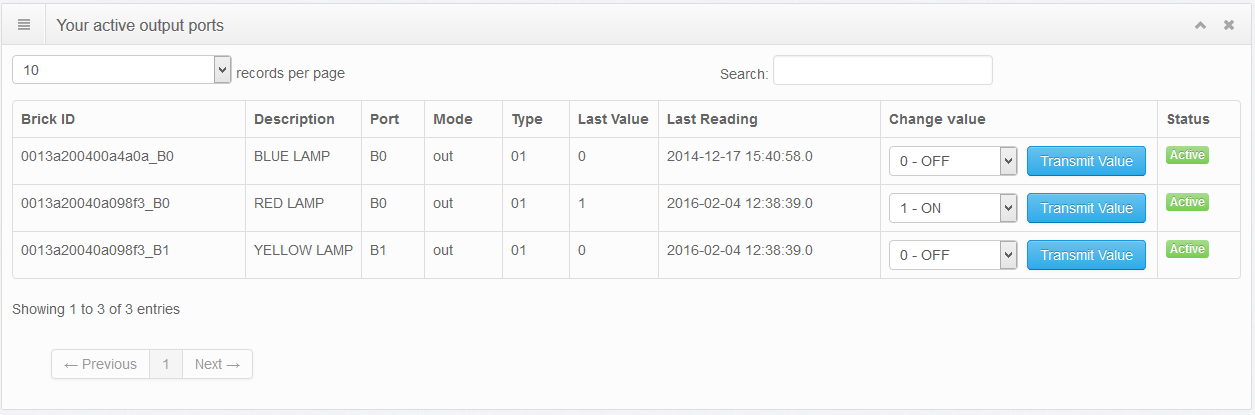
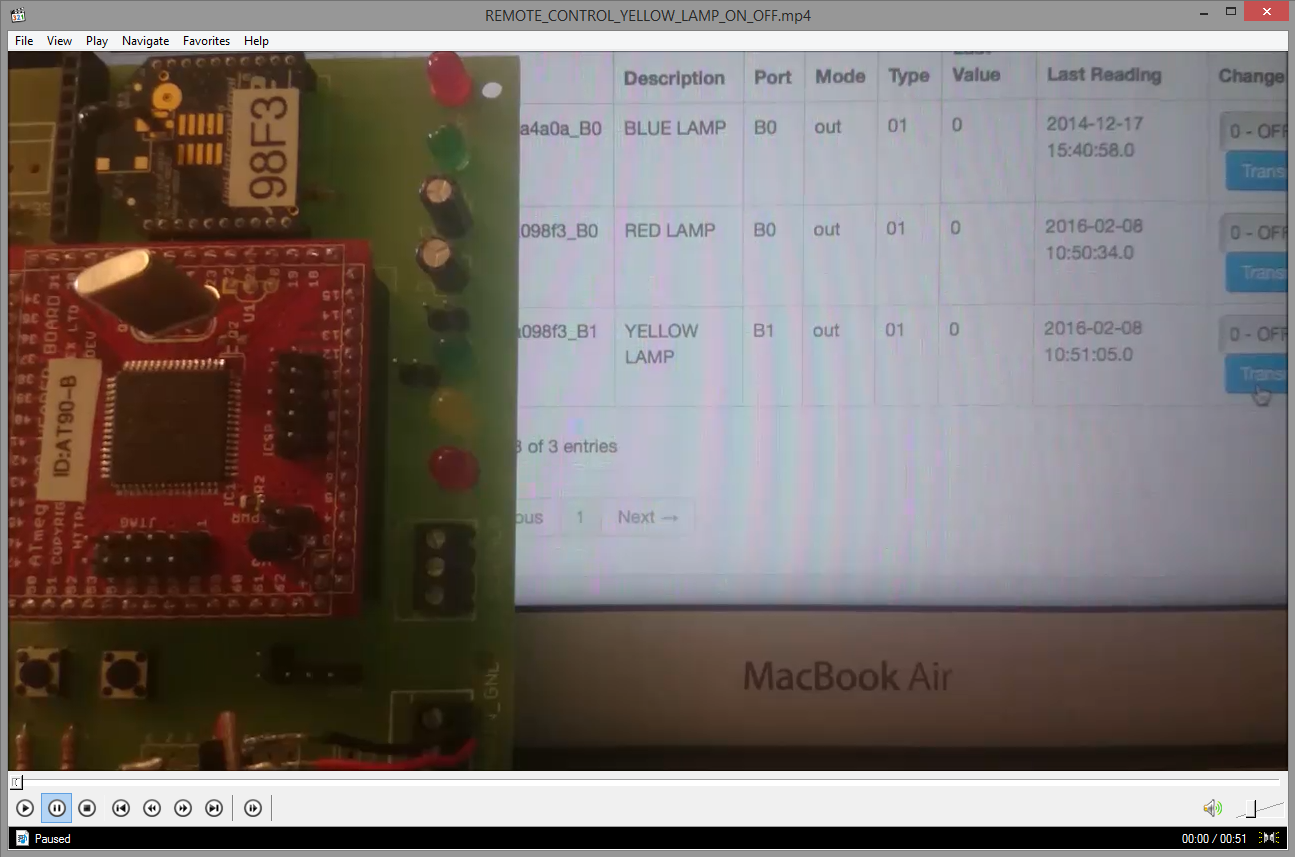
Manual Remote control
Control your gadgets via the Remote Control screen. This screen is divided in two sections.
- The top section lists all your active output ports. Here you control the output value of a single port.
- The bottom section lists all your active and inactive output ports. This list is similar to the Bricks list - though filtered by output ports.
Note: The time it takes from setting the output port into a specific state varies strongly. This is due to the fact, that TMOR is not a real time computing system. It sometimes happens, that changing an output port does not work as the serial messaging between TMOR base station and Brick is overloaded. We therefore strongly discourage you from using this feature in critical applications.
The following video shown the turning on and off of the yellow lamp which is located on the Brick prototype hardware.
This Brick is placed to the left of the Mac screen, so that manipulation on the HTML screen and the resulting output can be seen in a single screen.
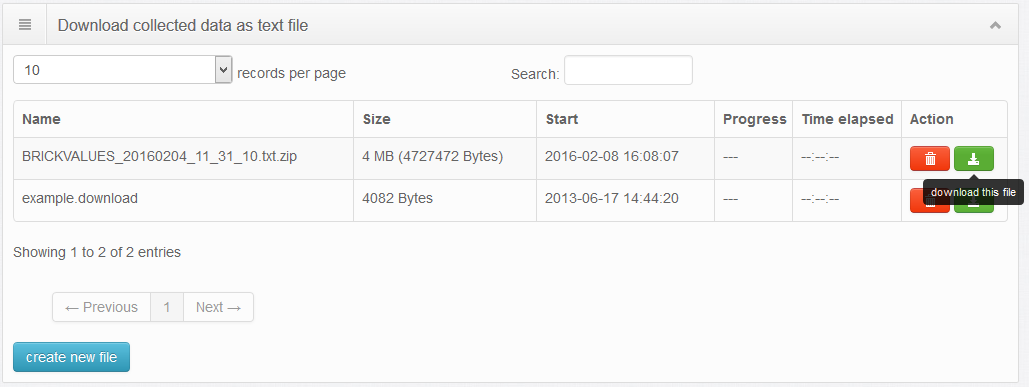
Manual Download
How to create a download file
A data export function can be found at page DLValues. Before a download can be made,
the data needs to be requested. By clicking create new file the
download file is created. This takes, depending on the collected data amount,
quite some time. Once the file is ready, it is zipped and copied into the download folder. There you can access it via the
green download button. The Progress and Time elapsed columns indicate the time spent and the progress of the data file creation.
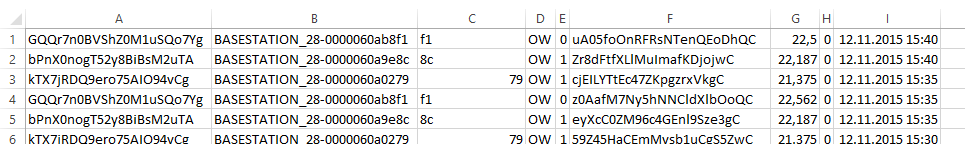
the tabulator separated file is structured in the following way:
- Column 1 Technical ID (DB primary key) of the data source
- Column 2 System ID of the data source - XBee Radio address or BASESTATION followed by the port
- Column 3 User description of the data source
- Column 4 Type of data source e.g. OW for 1-wire, or port address
- Column 5 Status of the data source - 0 = inactive and 1 = active
- Column 6 Technical ID (DB primary key) of the data value
- Column 7 Reading/Captured value itself of the data value
- Column 8 Data input descriptor - 0 = captured by the TMOR system, 1 = manual data import, 2 = simulated data
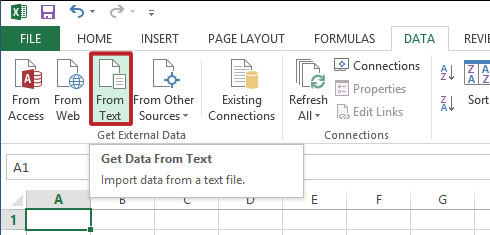
How to import the download into Excel
Open Microsoft Excel and chose on the empty spread sheet Menu DATA --> Get External Data --> From Text as shown below
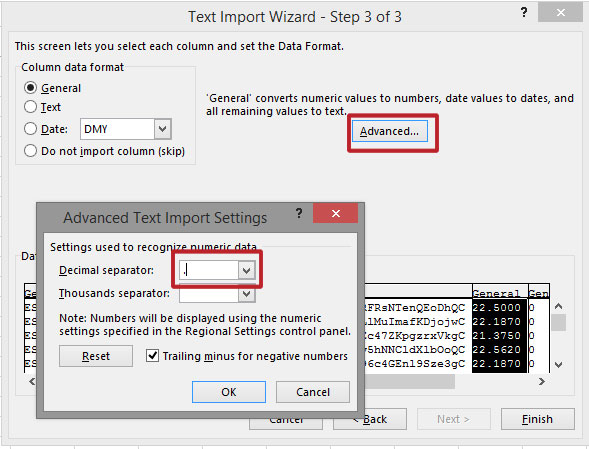
Once you chose and opened the file, you follow the Excel import wizzard as follows:
- Import Wizard Page 1 keep the
Delimitedoption - click Next button - Import Wizard Page 2 No other
Delimitersthan Tab is checked - Data preview should look "straight" - click Next button - Import Wizard Page 3 Tell Excel, that the
.Point character is the decimal character as shown below - and Press the Finish button
With pressing the Finish button, the data is imported to the selected location of the spread sheet. Choosing $A$1 should result in something like this:
Manual Rules and Alerts
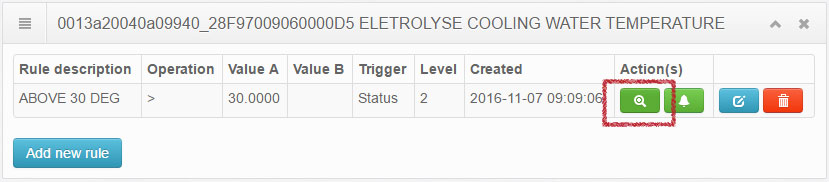
Act on your collected data! Send emails, tweets or change port status, when your dataset meets your predefined criteria. The Rules helps you setting up and managing this aspect of TMOR. The screenshot below shown the list of all our defined rules - grouped by data producer. As can be seen, there is only one rule defined.
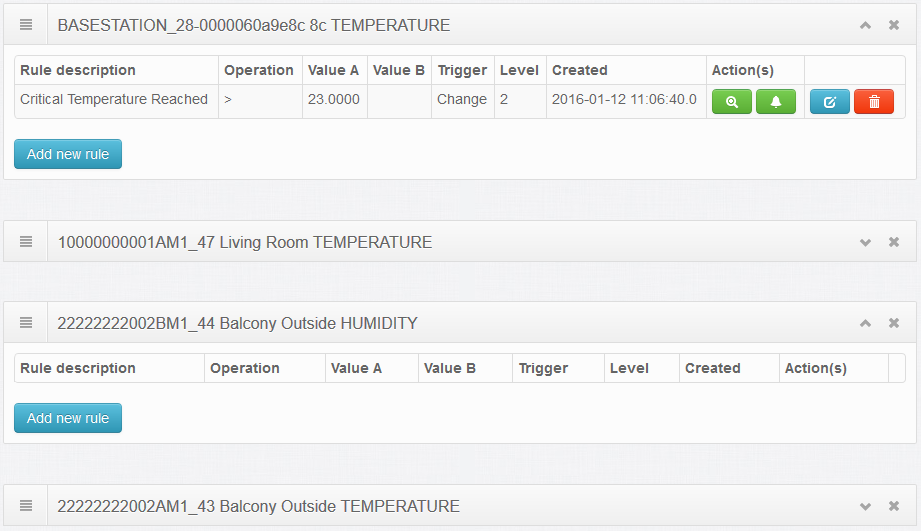
Click the icon to open the rule list tied to a specific data producer. Add a new rule for this data producer by pressing the Add new Rule button. A Modal window opens and among the following rules can be chosen:
- New data exists applies when a new measurement
xgot registered - independent of its value - Equal to value A applies when a new measurement
xgot registered and is equal=to valueA - Smaller than value A applies when a new measurement
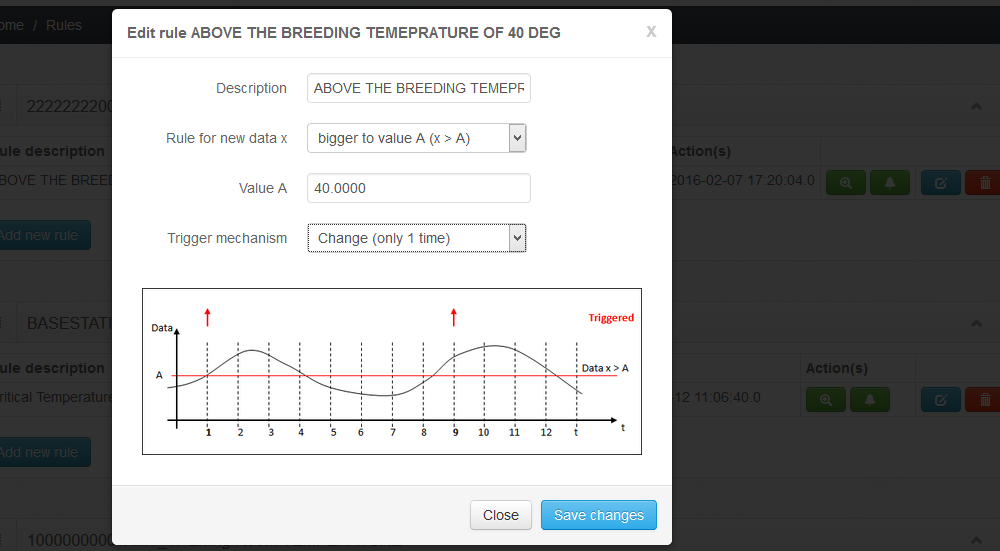
xgot registered and is smaller<to valueA - Bigger than value A applies when a new measurement
xgot registered and is bigger>to valueA - Between value A and B applies when a new measurement
xgot registered and is bigger>to valueAand smaller<than valueBassuming that B > A - Outside of data range between value A and B applies when a new measurement
xgot registered and is smaller<to valueAand bigger>than valueBassuming that B > A
- Status (as long as the rule holds true) will continue to trigger rule, despite the fact that the previously collected dataset triggered this rule. This option triggers lots of actions.
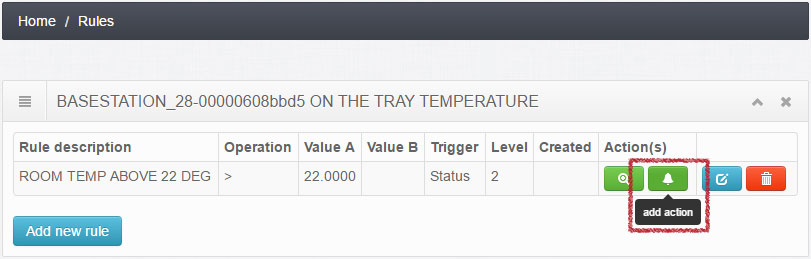
- Change (only one time) triggers the rule the first time. If the subsequent measurement also conforms to the rule, no action will be triggered. Only when the previously collected dataset did not conform to the rule and the subsequent one does, the action(s) will be triggered. This option triggers few action.
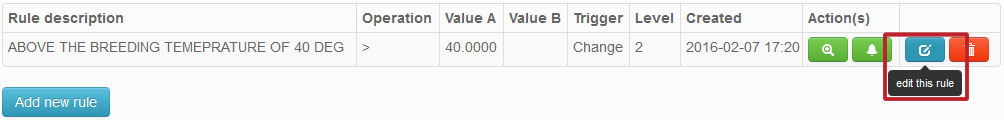
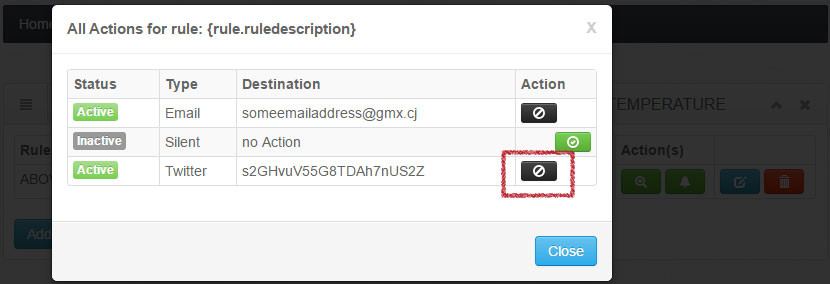
Once the appropriate rule was chosen and properly named (e.g. this rule name will appear in your messages), save the changes and add an action by pressing the green button. As shown below:
The following options exist:
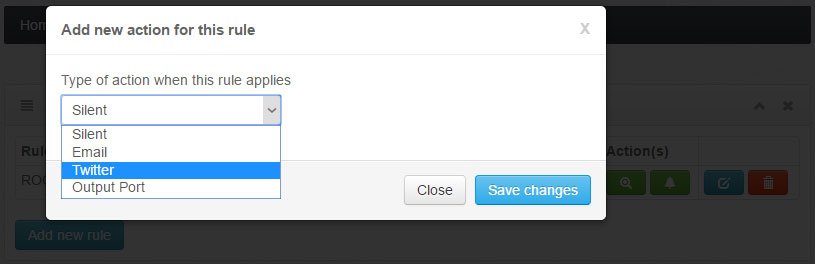
- Silent - TMOR creates a record that this rule got triggered - visible on the Index page here and here as well as in the Action Log page but no message is sent out - it's ideal for testing rules. Once the rule triggers as intended, additional actions such as email, tweet or output port can be added.
- Email - like silent but with an additional email to a specific recipient (for example your email address) - the email sending must be configured properly
- Twitter - like silent but with an additional tweet from a twitter account -
here you obtain the Twitter consumer key
and secret as well as your access token to authorize the TMOR app to twitter. These
Values need to the inserted into the following form.
Make sure to keep the keys secret as you don't want other people abusing your twitter account. A good practice is to define a separate twitter account solely for TMOR.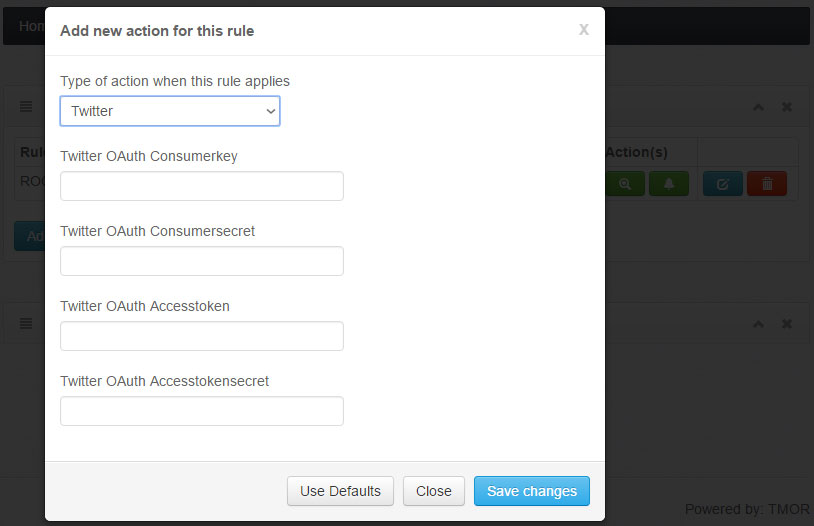
- Output Port - lets you select an active output port and which value should be transmitted to this port when the rule triggers.
Note: Output ports (named with a B) must be active. Otherwise your dropdown list for available output ports is empty. The current TMOR version does only provide output ports on the Brick module.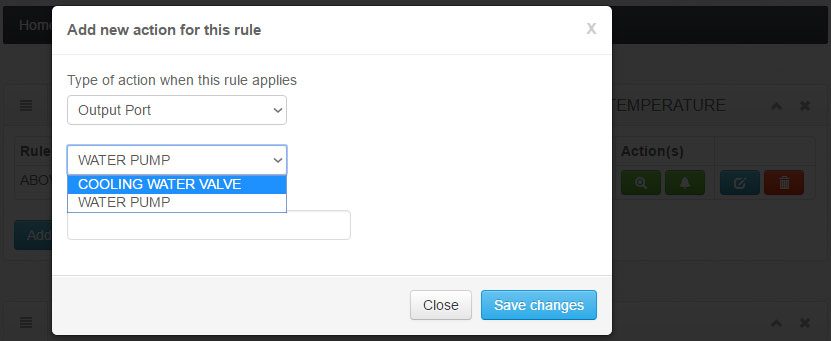
If you wish to inactivate an action, you simply disable it by clicking on the button to the right in the column Action. If you want to enable it, simply click on the disabled one (on the screenshot below the Silent action is disabled). The left column shows the current status. This way you do not need to delete the rule or action itself.
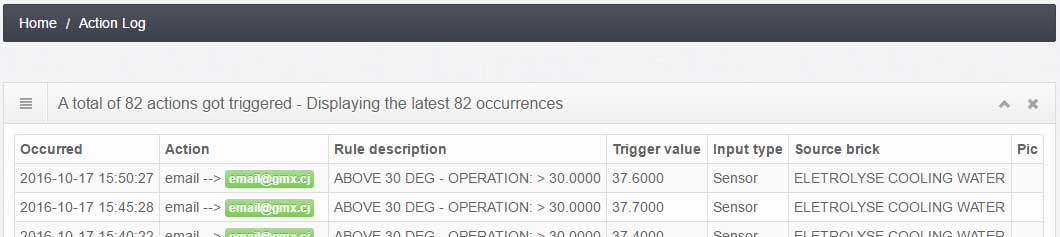
Manual Action Log
Once you defined your rules and its corresponding actions and the those defined rules triggered, the ActionLog page will display the actions, as well as its success. Act on your collected data! Send emails, tweets or change port status, when your dataset meets your predefined criteria. The Rules page helps you setting up and managing this aspect of TMOR. The screenshot below shown the list of all our defined rules - grouped by data producer. As can be seen, there is only one rule defined.
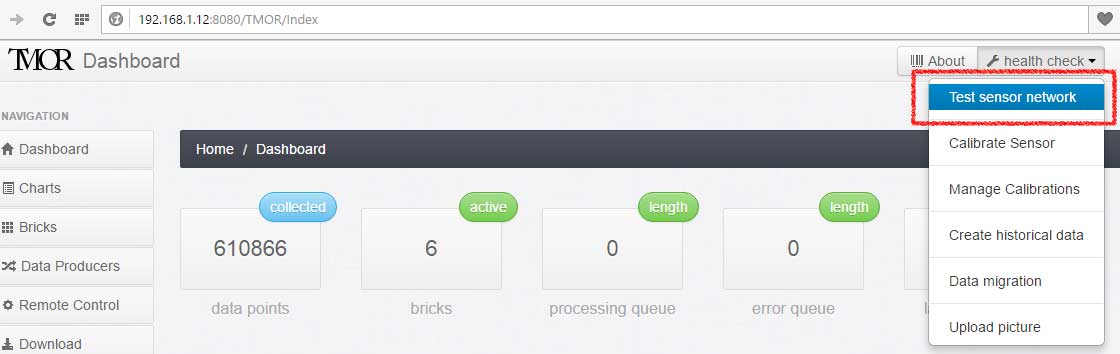
Manual Test Sensor Network
If you are running TMOR with an XBee radio network, then the functionalities provided under Test Sensor Network help you setting up and maintaining the XBee network. On the home screen select health check and chose menu entry Test sensor network to access the test network functionality.
Node Discovery
Node Discovery on the XBee ZBee protocol performs a network scan and checks which TMOR bricks can be identified. It is comparable to the TCP/IP scan command where one pings a whole network segment in order to see which computer is connected to the network. The following screenshot explains how to launch such a node discovery command.
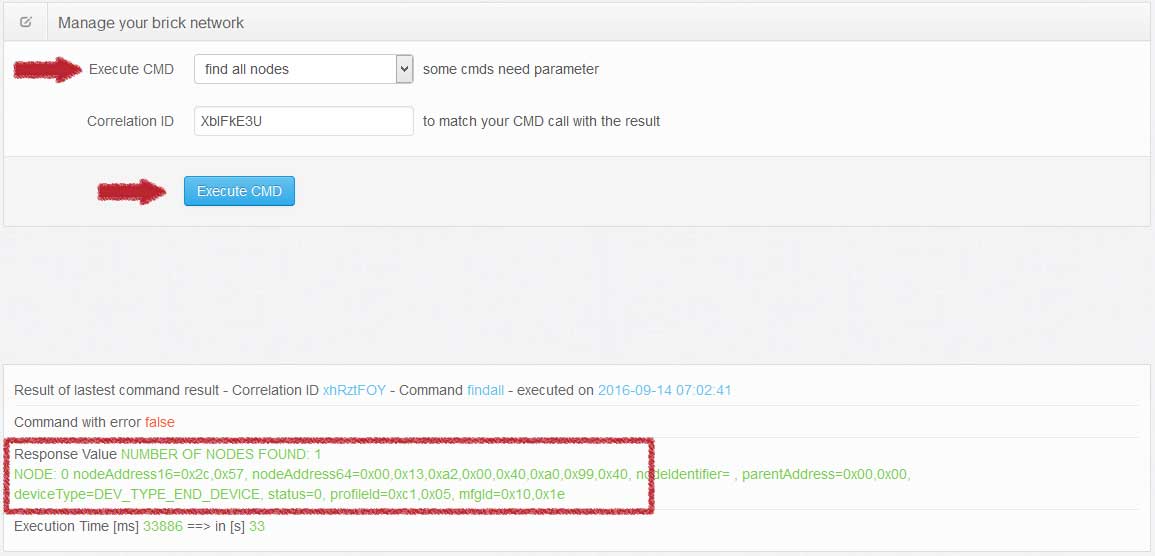
Execute CMD (Command): find all nodes
Correlation ID: 8 character random code
Button to execute the command
Note: Once you pressed the execute command button, the screen is refreshed.
The result is displayed right below the input form. This also generates a new random correlation ID.
The correlation ID is used to match the command execution with the result.
Some commands take quite some time to execute and hence the result appears sometime later. The green text in the result area is provided by the
JSON file data_result_manage_brick_network.json which is written a synchronically as soon as a command is sent.
So remember the correlation ID before pressing the button to be sure that the result displayed below matches your command and your expectation.
The green text holds the result of the command execution result (see json file locations data_result_manage_brick_network.json for more information). Here it shows that 1 node was found. Node 0 has the fixed address 0x00,0x13,0xa2,0x00,0x40,0xa0,0x99,0x4. This address can not be changed and is unique. It is also part of the sensor address, which can be looked up in the bricks view.
PING
This command sends a PING to a specific brick. By using this command you can check whether the target brick is reachable and alive or not. It is comparable to the TCP/IP ping command. Instead of the IP address you select the address of the XBee radio module. Note: Only before detected and registered bricks are listed in the drop down menu to choose from. The following screenshot explains how to launch the PING command and how to interpret the answer.
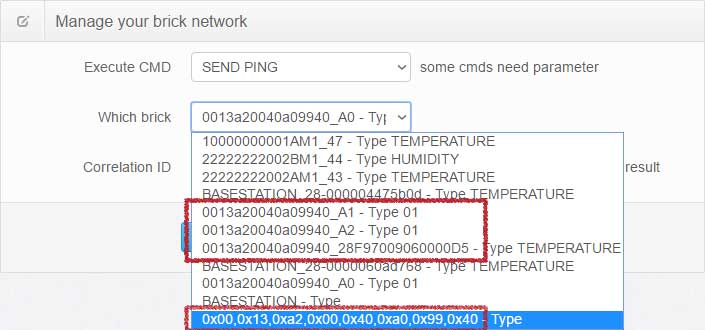
Execute CMD (Command): SEND PING
Which brick (Parameter): XBee 64 Bit address with or without port
Correlation ID: 8 character random code
Button to execute the command
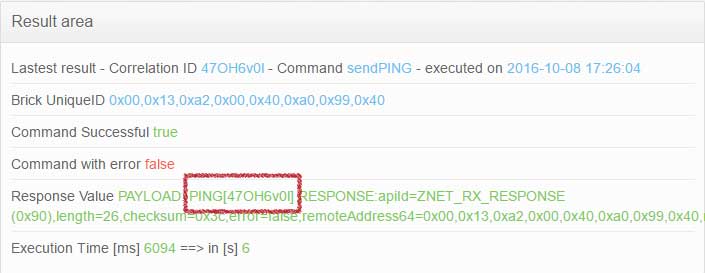
The screenshot below shows the result of a successful ping. The green text states: PING [CORRELATION ID] from the remote address 0x00,0x13,0xa2,0x00,0x40,0xa0,0x99,0x40.
The result is held in the json file data_result_manage_brick_network.json . An unsuccessful Ping just displays the
last executed command - as it might be a node discovery, or sensor reading - but no PING with your expected correlation ID.
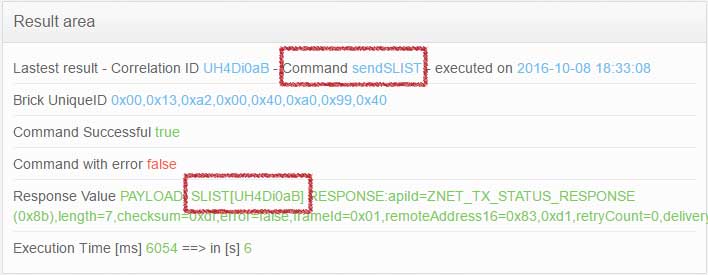
REQUEST SENSOR LIST
This command requests the list of sensors connected to the brick. The detail answer can be looked up
under
/var/tmp/sensors/filetrigger/brickconfig ( check chapter "Files and their locations" for more details).
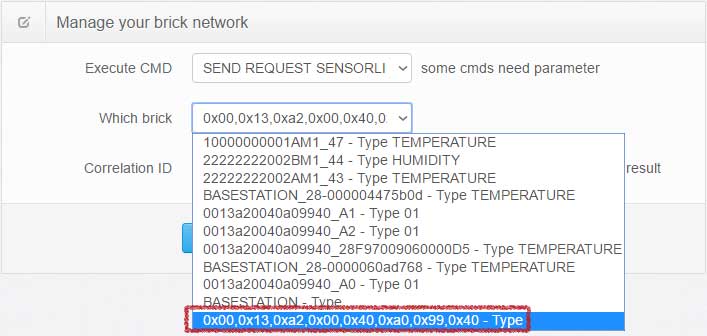
Execute CMD (Command): SEND REQUEST SENSOR LIST
Which brick (Parameter): XBee 64 Bit address without port
Correlation ID: 8 character random code
Button to execute the command
A successful request states in the result area: SLIST [CORRELATION ID]. The result is held in the json file data_result_manage_brick_network.json .
This request receives different answers depending on the configuration of the brick. It is therefore advisable not to request the sensor list right at the time when the brick is
involved in some other task, such as batch runs.
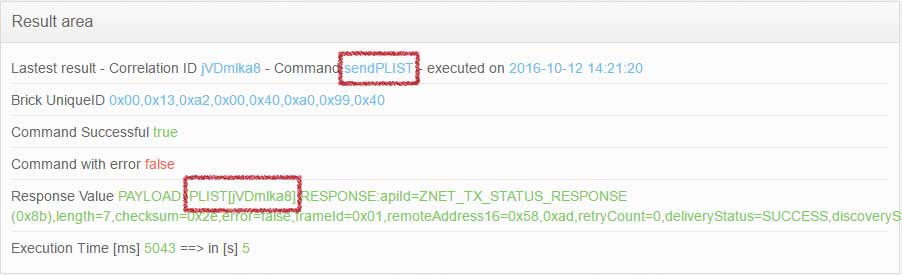
REQUEST PORT LIST
This command requests the list of output ports supported by the brick. The detail answer can be looked up
under
/var/tmp/sensors/filetrigger/brickconfig ( check chapter "Files and their locations" for more details).
This command is identical to the command REQUEST SENSOR LIST. The detail result file written in
/var/tmp/sensors/filetrigger/brickconfig. More information about the answer can be found in chapter
Files and their locations / port configuration.
Execute CMD (Command): SEND REQUEST PORT LIST
Which brick (Parameter): XBee 64 Bit address without port
Correlation ID: 8 character random code
Button to execute the command
A successful request states in the result area: PLIST [CORRELATION ID]. The result status is held in the json file data_result_manage_brick_network.json .
Manage Data
Since Version 3.18: This menu point provides the user with all tools to keep the data base tight and clean. todo
Manual Brick Direct Rules
Since Version 2.0: This type of rules resides on the brick itself. It is therefore faster and more reliable, as the data is not sent to the base station for processing. However, not all kind of rules an be mapped as direct rule.
Rules that send email or tweets need to be configured on the base station. See chapter Rules and Alerts. But rules that act directly on an output/actor port of the same brick are best implemented as Brick Direct Rule. Up to 16 direct rules can be defined per brick. This chapter explains how to define new, and modify existing rules. But lets start with a short theoretical intorduction on how direct rules are structured:
Direct Rule structure
Direct Rules hook into the following events or triggers:
- Input Ports with ID D0, D1, E6, E7 on high or low values
- Second timer - triggering on all 10, 20 or 30 seconds
- Minute timer - triggering on all 10, 20 or 30 minutes
The second part of the Direct Rule determines which other criteria / ow value needs to be met. These are the choices:
- Read the OW temperature sensor - and proceed to action part
- Read the OW temperature sensor - compare it with a predefined value - and maybe proceed to action part
- Read one of the three ADC values - and proceed to action part
- Read one of the three ADC values - compare it with a predefined value - and maybe proceed to action part
The last part of the Direct Rule determines the action. The action is only executed when the previous two conditions (e.g. trigger and optional criteria) are successfully passed. The following actions are available:
- Send an Event to Base Station
- Send the reading of the OW temperature sensor to Base Station
- Send the reading of one ADC values to Base Station
- Send a high or low to an output port
Let's get started by calling the Brick Direct Rules screen via Health check (dropdown menu on the top right of the screen):
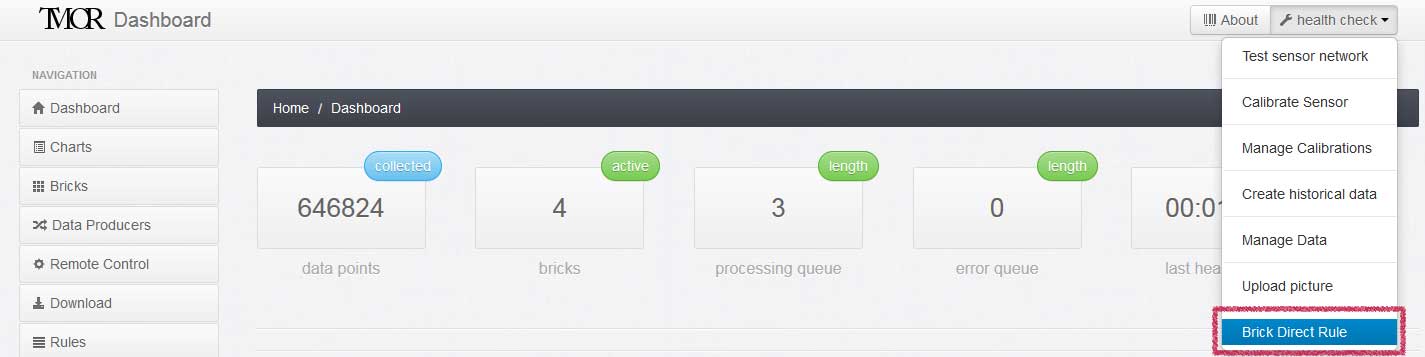
Which displays a list of all direct rules defined. Per brick, 16 direct rules can be defined. Each brick has 16 predefined rules. The rule definitions
are saved on the Basis station database and in the brick itself.
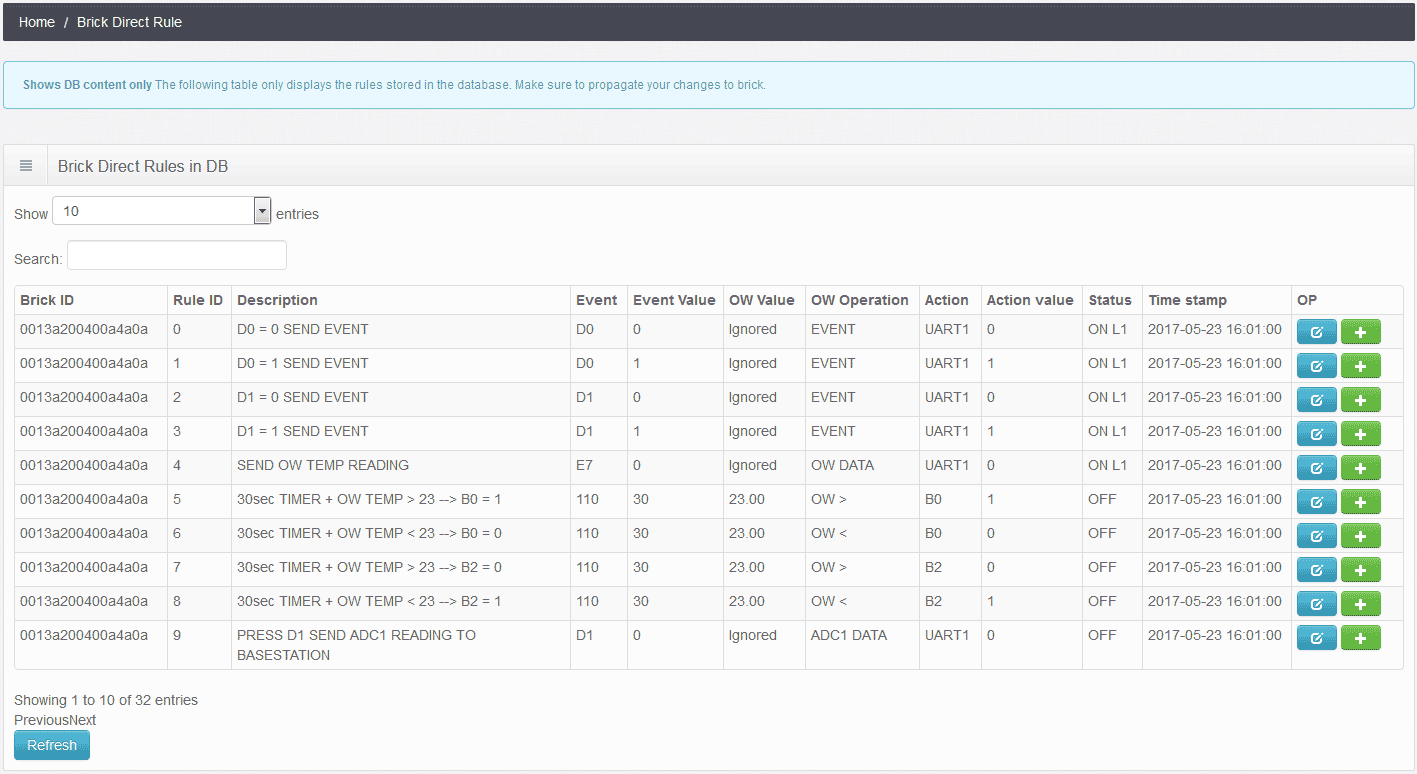 Lets quickly walk through the column of the above table (from left to right):
- Brick ID: Unique ID of the XBee radio module of the brick
- Rule ID: Number of the rule - from 0 to 15. Only numbers from 0 to 15 are allowed (total 16 rules).
- Description: Meaningful label to describe the rule
- Event: Event that calls for inspection of this rule
- Event Value: Condition that this event will trigger this rule (input line it is either 0 or 1, on timer it's the value 10, 20, 30)
- OW Value: Second criteria value - with implicit command to read sensor
- OW Operation: Smaller, Greater or Equal, Send reading value
- Action: Either to brick outport/actor or send Event to Base station
- Action Value: Either high or low (for outport/actor) or reading value to Base station
- Status: Is the rule active or inactive. If active some priority can be given over different rules
- Timestamp: Creation or alteration of this rule
Predefined Direct Rules
The set of predefined rules provide a rich set of examples, which cover all the possibilities of the Direct Rule engine. The list blow shows the different examples:
- Rule ID 0 and 1: Send an event to Base station when input line D0 changes to 0 or 1 respectively
- Rule ID 2 and 3: Send an event to Base station when input line D1 changes to 0 or 1 respectively
- Rule ID 4: Send OW temperature reading to Base station when input line E7 changes to 0 (button pressed)
- Rule ID 5 to 8: Are one set - switching on and off two output lines in complement fashion.
- Rule ID 5 and 6: Switches output line B0 to high when OW reading is above 23 Deg. Below 23 Deg. B0 is low
- Rule ID 7 and 8: Switches output line B2 to high when OW reading is below 23 Deg. Above 23 Deg. B2 is low
- Rule ID 9: Send ADC1 reading to Base station when input line D1 changes to 0 (button pressed)
- Rule ID 10: Send ADC2 reading to Base station when input line D1 changes to 0 (button pressed)
- Rule ID 11: Send ADC3 reading to Base station when input line D1 changes to 0 (button pressed)
- Rule ID 12 and 13: All 10 seconds the ADC1 value is read. IS the value below 512, then the outport B1 is low. If the reading is equal of above 512, then B1 is set high.
- Rule ID 14 and 15: Set the outport B0 according to the value of E6 - e.g. E6 = 1 then B0 = 1. If E6 = 0 then set B0 = 0.
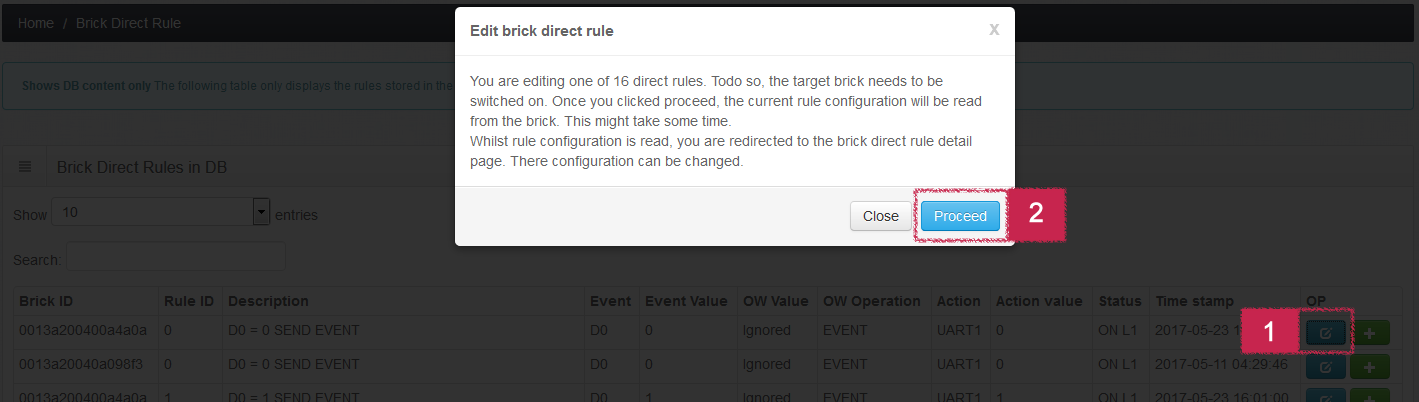
Editing Direct Rules
The Direct Rule detail screen is launched by fist choosing the rule to edit (number 1), and then confirming the selection in the modal pop up (number 2) - as shown below. With clicking the proceed button, the current rule data is read form the brick.
Once loaded, the detail page presents itself in the following way:
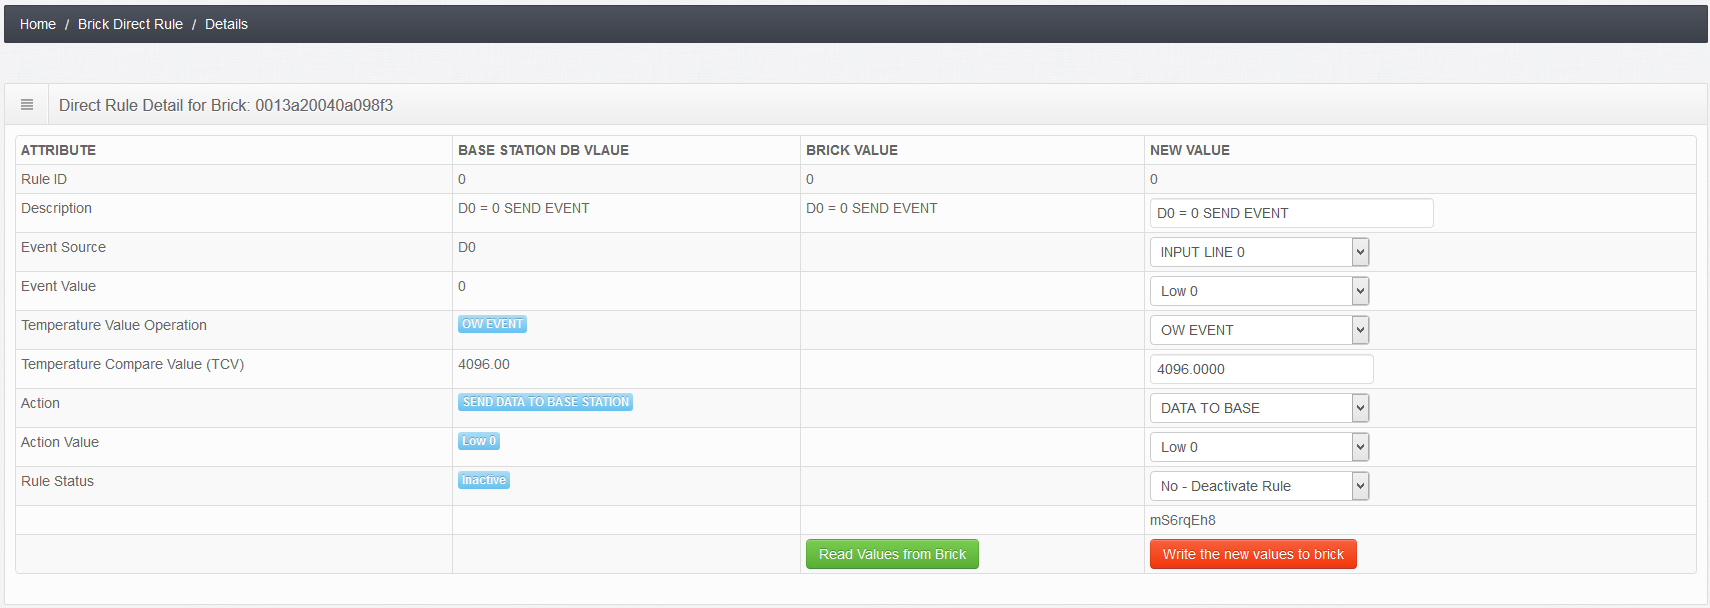
The table has three main section. The left column is the data base value, the middle one displays the values stored on the brick and the right column
is the input mask for the values. IF no Brick values are displayed (as is the case above) - relaunch the request by pressing the green button.
Once the request is successful the middle column will fill - as shown below.
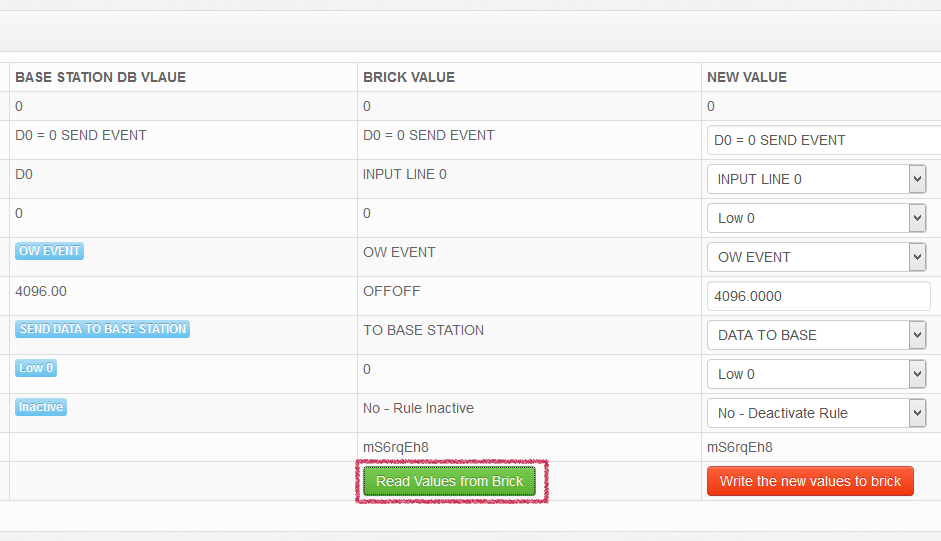
The input fields on the right column under NEW VALUE need to be changed in order to alter the selected Direct Rule. All the drop-down fields are straight forward and do not need further explanation. Some second criteria operator needs a value (link comparing the OW temperature to the value of 23.) The field Temperature Compare Value (TCV) needs to be populated. If an operation is chosen which does not require a value (such as send Event to Base station), then the default value is 4096.
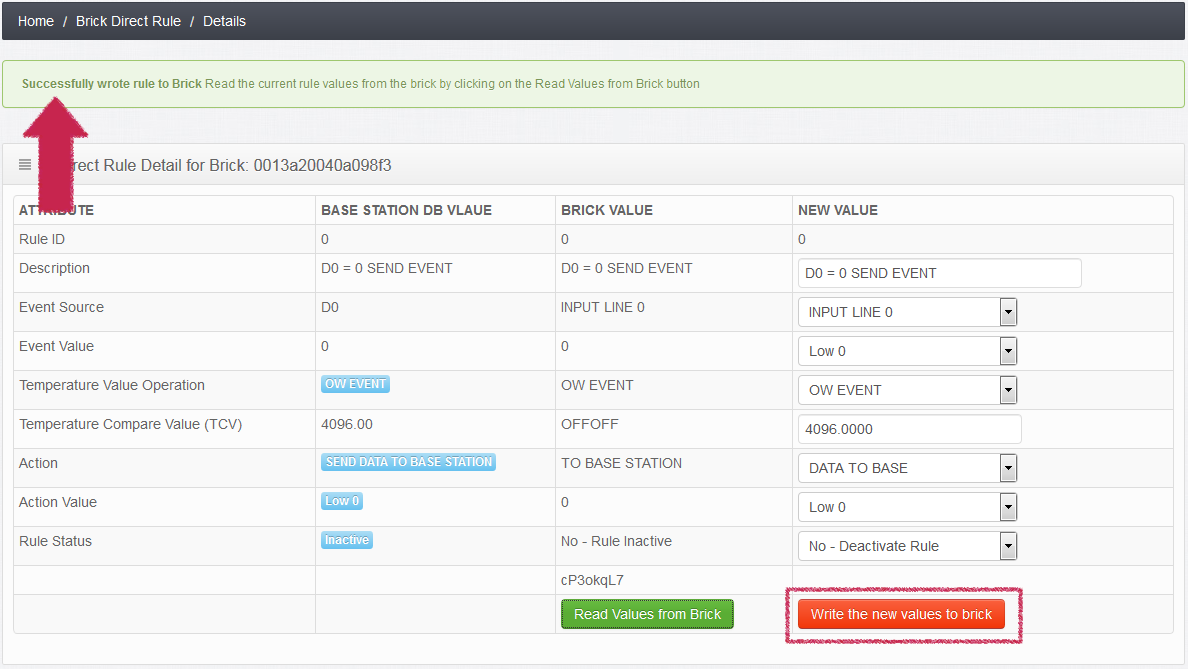
Once you pressed the red button 'Write the new values to brick', the new values will be written into the Base station database as well as the brick. Note: Wrting data to a remote brick might take some time. A good practice is to obeserve the Status and association LEDs of the base station radio module. Once the data exchange occured, press the green button 'Read values from brick' to double check on the successful update.
Data sharing via FTP
Since Version 3.0:
Publish your TMOR data on a 3rd party systems via sftp (secure file transfer protocol). With version 3.0 you can share historical data charts, histograms, probability density charts and time chats.
Pre-requisites
In order to share TMOR data via FTP, the following conditions must be met:
- Secure FTP user account to upload files to 3rd party server
- Basic HTML coding knowledge to embed the TMOR charts
- TMOR has constant and reliable Internet connection for uploading
If the above requirements are met, then follow the step by step manual to configure the FTP access to the 3rd party server.
FTP Server configuration
There are many different http web servers out there. This section covers only the setup for a Linux server running an Apache web server. The idea is to have for each data setup (sensor data group) a separate user which only can write to one specific directory (home directory). The following steps show how to create the restricted sftp group and the user bob as a member of it.
A. Type sudo addgroup sftponly to create group or sftp access
B. Type sudo useradd -d /home/bob -s /usr/lib/sftp-server -M -N -g sftponly bob to create the user bob with group or sftp
C. Type sudo passwd bob to assign a password for newly created user bob
D. Type sudo mkdir -p /home/bob/uploads /home/bob/.ssh to create upload folder where TMOR data wil be stored to
E. Type sudo chown bob:sftponly /home/bob/uploads /home/bob/.ssh set the owner for bob's upload directory
F. Type sudo chmod 700 /home/bob/.ssh set the permissions for bob's upload directory
Once the group and user are setup, a symbolic link to the home directory of the user is configured. This way, the webserver can access the home directory of the newly setup user (in our cas userer bob).
G. Type sudo ln -s /home/bob/uploads /var/www/3rdpartywebsite.com/public_html/uploads/bob symbolic link to the upload folder
H. Type sudo chmod ugo+r /var/www/3rdpartywebsite.com/public_html/uploads/bob make sure the sebserver an read the uploaded files
For each additional publication of data, the steps B to H need to be repeated. Best pratices show, that instead of using user names such as bob, on should use a project name, or location (such as fermentationprocess, gardenweather, watertemperature), to be clear which data sets we talk about.
Supported charts at glance
The following table shows, which JavaScript files are needed to display a certain graph on your web site.
| Chart Type | TMOR JavaScript File | HTML ID |
|---|---|---|
| Time series | custom_brickvalue_ftp_${technicalID}.js | brickValueTS${technicalID} |
| Historical percentile data series | custom_historical_data_zoom_template_${technicalID}.js | placeholder_zoom${technicalID}Histooverview${technicalID}Histo |
| Histogram chart | custom_brickvalue_histo_${technicalID}.js | brickValueHISTO${technicalID} |
| Prob. density chart | custom_brickvalue_probabilitydensity_${technicalID}.js | DensityStackchart |
HTML work for time series
Use the follow code snippets to publish time series such as this one.
Each brick (e.g. data producer) has a technical ID which is the database primary key of a table entry brickst. This unique ID is also used in the HTML and JavaScript code.
The JavaScript file which holds the Flot logic is called custom_brickvalue_ftp_${technicalID}.js,
where ${technicalID} is a placeholder for a 22 digit code.
In this example the ${technicalID} is 3EXFRsg7XfIHzSFzuEJWiw - which translates the filename to custom_brickvalue_ftp_3EXFRsg7XfIHzSFzuEJWiw.js.
Embed this js file into your HTML page with the following coding line:
<script type="text/javascript" src="uploads/bob/custom_brickvalue_ftp_${technicalID}.js"></script>
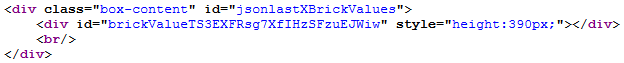
Use the following code at the location where you want the time series graph to appear on the HTML page:
<div class="box-content">
	<div id="brickValueTS${technicalID}" style="height:390px;"></div>
	<br/>
</div>
with the ${technicalID} being equal to 3EXFRsg7XfIHzSFzuEJWiw the code looks like this:
And finally make sure, to include all the Flot js files, so that the graphs can be rendered.
<script type="text/javascript" src="./js/flot/jquery.flot.min.js"></script>
<script type="text/javascript" src="./js/flot/jquery.flot.axislabels.js"></script>
Historical data chart
The historical data chart will be embedded by including the JavaScript file custom_historical_data_zoom_template_${technicalID}.js. The HTML code, which calls this JavaScript file looks as follow:
<script type="text/javascript" src="uploads/bob/custom_historical_data_zoom_template_${technicalID}.js"></script>
With the JavaScript included, you simply need to place this HTML code at the place, where the graph should appear.
<div class="box-content">
	<div id="placeholder_zoom${technicalID}Histo" class="center" style="height: 300px; padding: 0px; position: relative;"></div>
	<p>Select the time period you are interest in</p>
	<div id="overview${technicalID}Histo" style="height: 30px; padding: 0px; position: relative;"></div>
</div>
Don't forget to include Flot JavaScript files to render the graph correctly. With the following 4 JavaScript files the graphs
will be rendered correclty and the zoom functionality is supported.
<script type="text/javascript" src="./js/flot/jquery.flot.min.js"></script>
<script type="text/javascript" src="./js/flot/jquery.flot.axislabels.js"></script>

<script type="text/javascript" src="./js/flot/jquery.flot.fillbetween.js"></script>
<script type="text/javascript" src="./js/flot/jquery.flot.selection.js"></script>
Histogram and Probability density chart
The Histogram and Probability density chart will be embedded by including the following two JavaScript files: custom_brickvalue_probabilitydensity_${technicalID}.js and custom_brickvalue_histo_${technicalID}.js. The HTML code, which calls this JavaScript file looks as follow:
<script type="text/javascript" src="uploads/bob/custom_brickvalue_probabilitydensity_${technicalID}.js"></script>
<script type="text/javascript" src="uploads/bob/custom_brickvalue_histo_${technicalID}.js"></script>
With these JavaScripts included, one simply needs to the following HTML code at the place, where the histogram should appear.
<div class="box-content">
	<div id="brickValueHISTO${technicalID}" style="height:390px;"></div>
	<br/>
</div>
The subsequent HTML snippet will render the probability density chart.
<div class="box-content">
	<div id="DensityStackchart" style="height:390px;"></div>
	<br/>
</div>
Note: The density chart key does not contain any technicalID and therefore only one desity chart is possible on one HTML page. The following three Flot JavaScript files are needed to render the graph correctly.
<script type="text/javascript" src="./js/flot/jquery.flot.min.js"></script>
<script type="text/javascript" src="./js/flot/jquery.flot.axislabels.js"></script>

<script type="text/javascript" src="./js/flot/jquery.flot.fillbetween.js"></script>
FTP file upload configuration
By calling the URL: ${IP_ADDRESS}:8080/TMOR/ftpserver the FTP publishing screen is loaded.
This screen is split into two sections: The available FTP servers, (which should be empty when calling the first time), and
a subsequent list of tables showing which brick is publishing to which FTP server.
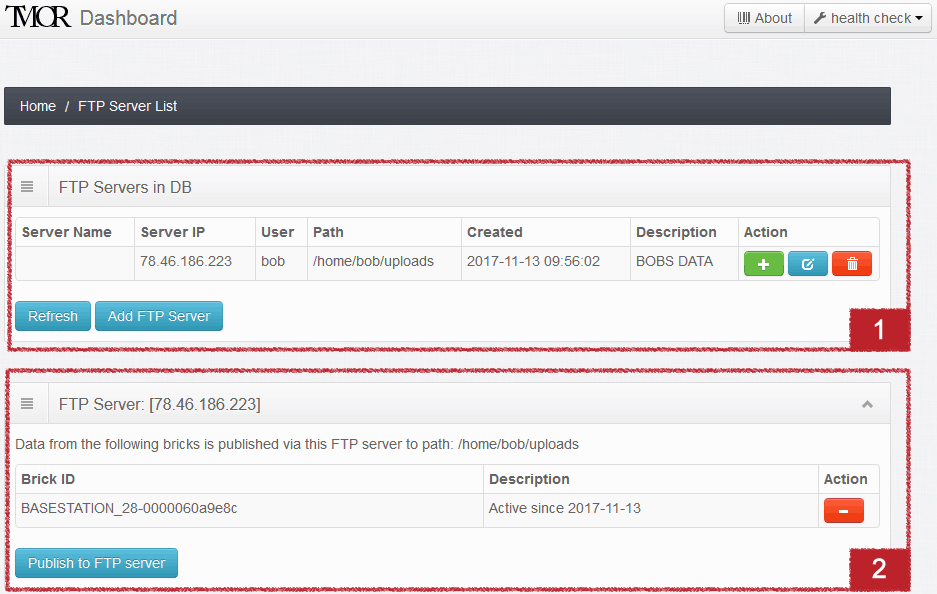
Use the Add FTP Server button to enter a new SFTP connection (including user).
Check here how to prepare the SFTP server itself.
The green allows you to add data of a particular brick. The blue form button allows you to change data of the already
existing SFTP server.
Note: On the SFTP server form, one can enter IP and/or Server Name (e.g. domain name). TMOR works primarily with the provided IP address. If both information (IP address and Server name) are provided, then the IP address will be taken. We therefore recommend to provide only the server name data field, and to leave the IP field empty. Esp. when the IP address is dynamic/not fix.
Out of the box, the brick data is transmitted all 3 hours. The color is standard - as in the Bricks Value page. However, if necessary, these parameters can be changed, so that it better suits your requirements. By clicking the edit button on the FTP server list, as shown below, one change these properties.
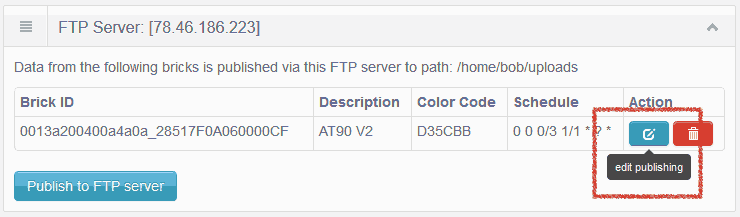
By clicking the blue button, the following pop-up screen appears.
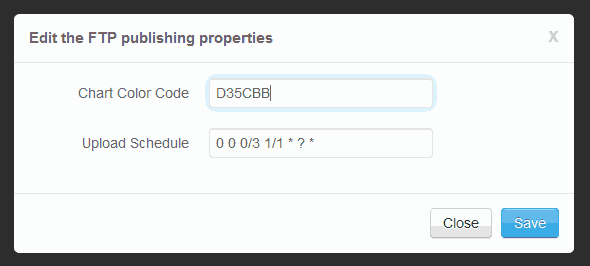
The field Chart color Code determines which color code will be used for the time series. Enter here a 6 digit hex code (like #bc2129). color picker sites like this can help you select the color code you want to use. With this feature, you can trim TMOR time series graphs to your color scheme of the 3rd party web page.
The field Upload Schedule determines how often data will be transmitted to the 3rd party FTP server. Keep in mind, that the periodicity of this upload requires not only bandwidth but also computational power of TMOR base station. At the moment the following upload schedules are supported:
- use
0 0 0/1 1/1 * ? *to upload data each hour - use
0 0 0/3 1/1 * ? *to upload data all 3 hours - use
0 0 0/12 1/1 * ? *to upload data all 12 hours
Only data files, that changed in size or content will be uploaded. Not all files will be newly generated. the following table provides an overview about calculation and color code sensitivity.
| Chart Type | Time of file production | FTP pub. properties |
|---|---|---|
| Time series | When FTP cron schedule runs | color and cron schedule |
| Historical percentile data series | Default daily once at 02:13h | neither |
| Histogram chart | When FTP cron schedule runs | cron schedule |
| Prob. density chart | When FTP cron schedule runs | cron schedule |
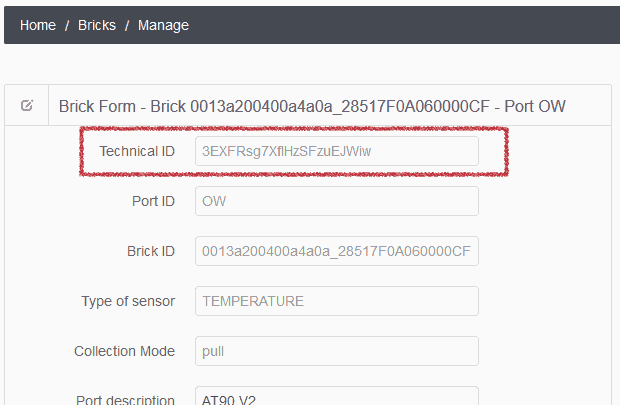
How to obtain the ${technicalID}?
The technical Id ${technicalID} is essential for embedding TMOR charts on your 3rd party web server. The technical ID is can be obtained
by quering the TMOR database table brickst, or by calling the bricks page ${IP_ADDRESS}:8080/TMOR/bricks and clicking at the
brick ID column on the specific brick as shown below:
Once you clicked on the brick you want to publish, the manage brick page opens. Here, the first field holds the 22 digit technical ID. It can not be edited - just copy the field content and use it in the code needed to embed the graphs.
Another way to obtain this technical ID is by quering the database table. Connect to your TMOR database with the SQL workbench and
execute hte query select * from brickst. The result of the query should look similar to this:
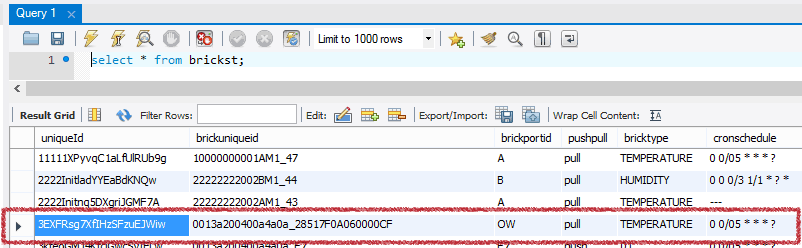
The value stored in column uniqueId is equivalent to technicalID ${technicalID}. Check for your brick by looking at column brickuniqueid to pick the right one.
How use key data in your own web site
Key data, such as last reading value, of amount of data displayed in chart can be obtained the following way:
<div>Wert letzte Messung: <span style="color:blue" id="youngestValuerTZm6XxmVDkEqvKbcGzY0A">blue</span> Grad</div>
<div>Zeit letzte Messung: <span style="color:blue" id="youngestDaterTZm6XxmVDkEqvKbcGzY0A">blue</span></div>
<div>Anzahl Messungen:    <span style="color:blue" id="dataCountrTZm6XxmVDkEqvKbcGzY0A">blue</span></div>
<div>Wert erste Messung:  <span style="color:blue" id="oldestValuerTZm6XxmVDkEqvKbcGzY0A">blue</span> Grad</div>
<div>Zeit erste Messung:  <span style="color:blue" id="oldestDaterTZm6XxmVDkEqvKbcGzY0A">blue</span></div>
In the above example, the technial ID is rTZm6XxmVDkEqvKbcGzY0A. The HTML tag id is youngestValue${technicalID}, youngestDate${technicalID}, dataCount${technicalID} and so on. These fields are populated by the custom_brickvalue_zoom_ftp_${technicalID}.js file.
Troubleshooting
Can't connect to TOMR Base station web page
If you can not reach the TMOR Base station web page http://{IP ADDESS}:8080/TMOR/JSPIndex make sure that:
1. All the cables (power cable, network cable, sensor cables) are connected
2. TMOR runs - the LED lights are blinking
3. You see TMOR Base station with its ip address in the list of connected devices on your Gateway / Router / DHPC server.
4. You can ping TOMR Base station as described here or here.
If you successfully can proceed through steps 1 to 4, then your network setup is most likely correct. So connect to the TMOR console by using putty or another remote shell program. If connecting to the console is not possible then you have problem on the physical layer. Recheck steps 1 to 4 as described above. Make also sure that you don not have a firewall (or something similar) between your workstation and the TMOR Base station.
Once you logged in successfully to the console of the Base station check the following:
A. Type ps -ef | grep java to see whether all programs are running - The result should look similar to this
xbee      2195  2077  5 Jan20 ?        04:27:13 java -Djava.library.path=/usr/lib/jni -Dlog4j.configuration=file:/usr/share/tomcat/lib/log4jxbee.properties -cp pi4j-core.jar:/usr/share/xbee/XBEE.jar:/usr/share/xbee/GLOBAL.jar:RXTXcomm-2.2pre2.jar:/usr/share/tomcat/lib/flexjson-2.1.jar:/usr/share/tomcat/lib/log4j-1.2.16.jar:/usr/share/tomcat/lib/commons-vfs-1.0.jar:/usr/share/tomcat/lib/commons-logging-1.1.1.jar com.moneyhouse.sensors.xbee.SerialReceiver8
tomcat    2197     1  3 Jan20 ?        02:45:52 /opt/java/jdk1.8.0_33/bin/java -Djava.util.logging.config.file=/usr/share/tomcat/conf/logging.properties -Djava.util.logging.manager=org.apache.juli.ClassLoaderLogManager -Djava.endorsed.dirs=/usr/share/tomcat/endorsed -classpath /usr/share/tomcat/bin/bootstrap.jar:/usr/share/tomcat/bin/tomcat-juli.jar -Dcatalina.base=/usr/share/tomcat -Dcatalina.home=/usr/share/tomcat -Djava.io.tmpdir=/usr/share/tomcat/temp org.apache.catalina.startup.Bootstrap start
If the two processes show up it seems to be an application specific problem. Proceed to point B to check the log files. If the two processes do not show up, then restart the system by typting into the console
sudo reboot now . A reboot automatically restarts the two processes, then proceed with Step B.
B. The two processes are running. So check the youngest tomcat access log file localhost_access_log.{date}.txt. It can be found in path /usr/shar/tomcat/log. Look at The content of the access file by typing command more localhost_access_log.{date}.txt. It should look like this:
192.168.1.85 - - [23/Jan/2016:17:03:53 +0000] "GET /TMOR/JSPIndex HTTP/1.1" 200 22761
192.168.1.85 - - [23/Jan/2016:17:03:53 +0000] "GET /TMOR/upload/DSC03304_COMPRESSED.jpg HTTP/1.1" 404 1053
192.168.1.85 - - [23/Jan/2016:17:03:53 +0000] "GET /TMOR/js/custom_stackchart_datapoints_100days.js HTTP/1.1" 200 2649
192.168.1.85 - - [23/Jan/2016:17:03:53 +0000] "GET /TMOR/img/logo/SMALL_ICON_4.png HTTP/1.1" 304 -
192.168.1.85 - - [23/Jan/2016:17:03:54 +0000] "GET /TMOR/data-points-total.json HTTP/1.1" 200 393
192.168.1.85 - - [23/Jan/2016:17:03:54 +0000] "GET /TMOR/data-points-total.json HTTP/1.1" 304 -
Here you should see the requests to the web user interface. If you see your HTTP requests in this log file but you don't get an answer, then proceed to step C in order to check application log file. C. Take a look at the end of the log file
Processing queue counter increases constantly
This counter basically counts the file in the /var/tmp/sensors/filetrigger/tobrick directory (see chapter file locations for more information). If this counter increases incessantly you know that the Serial module is not working properly. This can be the reasons:
- The Serial module process stopped working - check whether the xbee process is running
- The system is overloaded with erroneous requests - check the queue content
TO BRICK QUEUE LIST CREATED TIMESTAMP: 2016-02-05 08:38:07 is displayed, then every thing is fine. Otherwise this statement is followed by the queue entry list.
Looking into logfile xbee_serial.log might also provide some insights on how to fix the situation. A reboot of the Base station might fix it as it automatically empties the communication files directories.
Error queue counter indication
If messages (coming from the bricks network or from the TMOR Batch or Presentation module) where handled but not processed as expected this error counter increases. Such cases can be:
- A pull request reading a sensor that is not connected - check the physical connection of sensor
- Trying to contact a brick module that is not "online" - check the connectivity of the brick
- A value parsing problem that results in a mal functioning - check the responsible file
ERROR QUEUE LIST CREATED TIMESTAMP: 2016-02-05 14:35:01
[0]		2016/02/05 12:30:02.030	ADDRESS_NOT_FOUND	COUNTER= 1	/var/tmp/sensors/filetrigger/tobrick/BATCH_PULL__0x00,0x13,0xa2,0x00,0x40,0x0a,0x42,0xc5__CORR_97LqxHUR__1pAyoOFJcEs58wc3zBA90w.txt
[1]		2016/02/05 12:30:03.030	ADDRESS_NOT_FOUND	COUNTER= 1	/var/tmp/sensors/filetrigger/tobrick/BATCH_PULL__0x00,0x13,0xa2,0x00,0x40,0xa4,0xd7,0x91__CORR_t8Vo69Jb__b2LqLi1VeXYICR6e6FqxnQ.txt
[2]		2016/02/05 12:30:04.030	TOO_MANY_TRIES		COUNTER= 10	/var/tmp/sensors/filetrigger/tobrick/BATCH_PULL__BASESTATION__CORR_8j-cWfr5__Qg2Mj1FGeGOLewGXVwMqhg.txt
[3]		2016/02/05 12:30:06.030	ADDRESS_NOT_FOUND	COUNTER= 1	/var/tmp/sensors/filetrigger/tobrick/BATCH_PULL__0x00,0x13,0xa2,0x00,0x40,0x0a,0x4a,0x0a__CORR_YQx8xC1g__TXvi2DQFipmKLXh6hqNkuA.txt
In some instances the system tries up to 10 times
COUNTER= 10 to achieve the goal and on other occasions (like the XBee radio is not present) only one time COUNTER= 1. The reason and the root cause are also displayed here such as
ADDRESS_NOT_FOUND or TOO_MANY_TRIES. Another way to get more insights on what is going on can be found under menu point Event Log. There the successful and the failed commands are listed. It should be noted that all messages older than 2 hours are deleted and that constant queue length counters are absolutely normal.
Files and their locations
Log files
All logfiles are located in the directory /usr/share/tomcat/logs. There you find the following log files:
- Access logfile holding all the HTTP requests:
localhost_access_log.2016-01-23.txt
- Tomcat logfile logging all things within Tomcat:
catalina.outand older log files with datecatalina.{YYYY-MM-DD}.log - TMOR Batch module logfile
sensors_batch_module_roll.logand older log files with numberssensors_batch_module_roll.log{number}
- TMOR Presentaion module timing logfile holding execution durations
timing_and_performance.logand older log files with numberstiming_and_performance.log{number} - TMOR Serial module logfile
xbee_serial.logand older log files with numbersxbee_serial.log{number} - TMOR Serial module logfile holding the requests
xbee_requests.logand older log files with numbersxbee_requests.log{number} - TMOR Serial module logfile holding the requests and the queue content
xbee_requests_queue.logand older log files with numbersxbee_requests_queue.log{number}- its off by default - TMOR Serial module logging the raplogic wrapper code
xbee_3rd_rapplogic.logand older log files with numbersxbee_3rd_rapplogic.log{number}
Configuration files
The configuration of the logfiles is done here:
/usr/share/tomcat/lib/log4jxbee.properties- for logfile
/usr/share/tomcat/logs/xbee_serial.log - for logfile
/usr/share/tomcat/logs/xbee_requests.log - for logfile
/usr/share/tomcat/logs/xbee_3rd_rapplogic.log
- for logfile
/usr/share/tomcat/lib/log4jxbee.properties- for logfile
/usr/share/tomcat/logs/sensors_batch_module_roll.log - for logfile
/usr/share/tomcat/logs/timing_and_performance.log - for logfile
/usr/share/tomcat/logs/catalina.out
- for logfile
The TMOR configuration file tmor.properties is located in /usr/share/tomcat/lib. How to adapt TMOR to your needs is described here in detail.
Communication files
Data exchange between TMOR Batch module and Serial module is done via the file system to assure an asynchronous interaction. The schematic setup looks like this:
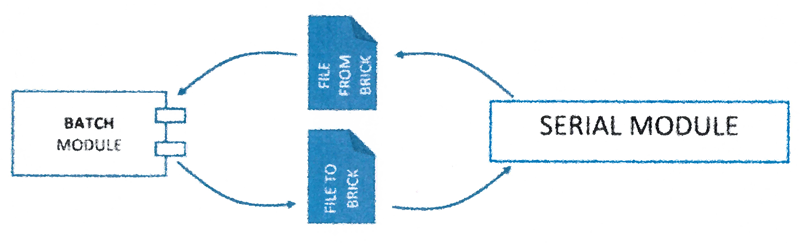
The directories are located there:
- For request from the Batch module:
/var/tmp/sensors/filetrigger/tobrick - Once the Batch module request was processed:
/var/tmp/sensors/filetrigger/tobrick-processed - Information comming from the Serial module:
/var/tmp/sensors/filetrigger/frombrick - XBee configuration information from Serial module:
/var/tmp/sensors/filetrigger/brickconfig
xbee and the group www-data.
File permission for those directories is drwxrwsr-x. If ownership or file permission change, then no proper operation can be guaranteed.
It is very easy to hook into the TMOR system, as the file system is used as communication channel between the single TMOR components. The most common file types are explained in more detail:
- A sensor reading request file is named like this:
BATCH_PULL__BASESTATION__CORR_1KHhqfdu__dvKM5OQxJHRS3WGBPC4LDw.txtBATCH_PULLindicates the reading request from the TMOR batch module,BASESTATIONnames the target - here the base station itself or0x00,0x13,0xa2,0x00,0x40,0xa4,0xd7,0x91for a brick. The sectionCORR_ZXrGhMooprints out the unique correlation ID which is later on used to match the response from serial module with the request. The last part of the file name is a random string making sure that the file name is unique.
BASESTATION readOW 28-000006096ced zszBeRwL 2016-02-06 17:30:01.073
The first chunk is the Brick address, the second the commandreadOW- here its reading the 1-wire port and the third argunet holds the address of the sensor to read. Within the text file can be found the correlation Id again and the last argument is the time stamp of the request. - An exemplary heartbeat file name is
HEARTBEAT_UID_dT4PYgQK__kBP4MMU3fqj1nByzXSfqzQ.txt. Starting withHEARTBEATit indicates, that this file is checking operational status of the Base station. TheUID_dT4PYgQKstands for the correlation Id and the last random String makes sure that this filename is unique. - Changing the output port value is initiated by sending a command file. Starting with
COMMANDand the usual correlation Id, this file holds as content which output port should switch to which value.
Below is the file content where commandsendSPTwith address (e.g. port)B1sets the value to0.
This command does not return an answer.
0x00,0x13,0xa2,0x00,0x40,0xa0,0x98,0xf3 sendSPTB1 0 0xsFWzIL 2016-02-09 13:37:27.02
- The read sensor/port configuration request is
triggered by sending a command file with the content
sendSLISTorsendPLIST. Click here for more information on how to request the sensor list for test purposes or the (output) port list. The filename starts withCOMMANDand the usual correlation ID, this file holds as content which brick needs to return the sensor/port list.
0x00,0x13,0xa2,0x00,0x40,0xa0,0x99,0x40 sendSLIST _ BOlcBLV1 2016-10-12 13:22:50.06
This initiates an answer which can vary in length (depending on how many 1-wire sensors and ports are connected to the brick or Basestation). The answer to this request is found in directory/var/tmp/sensors/filetrigger/brickconfig. As the answer varies to the number of sensors connected, one or more file can be written into the directory/var/tmp/sensors/filetrigger/brickconfig. The file names are similar, as the last character of the correlation code in the file name is incremented - as shown in the picture below where the correlation code BOlcBLV1 and BOlcBLV2 belong to the same request.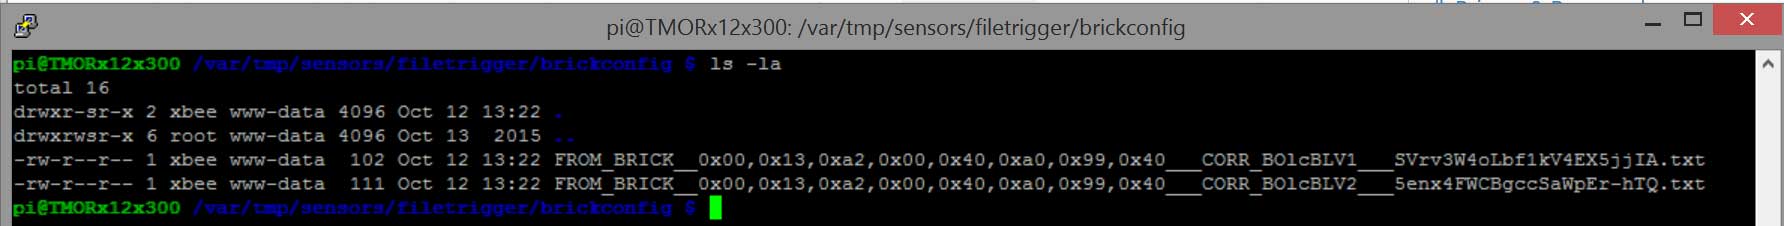
Let's look at the content of the two files from the sensor list request have the following content:
0x00,0x13,0xa2,0x00,0x40,0xa0,0x99,0x40 SLIST BOlcBLV1 A 01234567 I 2016-10-12 13:22:54 EXECUTIONTIME=
In plain English: 0x00,0x13,0xa2,0x00,0x40,0xa0,0x99,0x40 stands for the 64 Bit XBee radio address,
SLIST response to the command,
BOlcBLV1 is the correlation ID to match request with response, and
parameter A is the port address-prefix. The 01234567 shows, that this brick has 8 input ports available. Their port addresses are A0, A1, up to A7.
The I indicates it's an input and the rest is date & timestamp as well as the execution time - here not provided.0x00,0x13,0xa2,0x00,0x40,0xa0,0x99,0x40 SLIST BOlcBLV2 OW 28F97009060000D5 I 2016-10-12 13:22:57 EXECUTIONTIME=
Similar to the first file, on first position is the 64 Bit XBee radio address identifying the expeditor brick.
SLIST response to the command,
. The correlation ID (here BOlcBLV2) matches the request with response - note here how the last letter is a 2, whereas the correlation ID of the first response is a 1. OW stands for the 1-wire port.
The parameter 28F97009060000D5 shows the unique 1-wire address of this sensor.
I stands for input. Date & timestamp as well as the execution time follow.Note: Should a brick contain a configuration with two or 1-wire sensors, than whe would receive three files. The two files are mentioned above, plus the third file for the second 1-wire sensor. This file would hold the correlation ID BOlcBLV3.
Requesting a port list will return a file which has the following content:
0x00,0x13,0xa2,0x00,0x40,0xa0,0x99,0x40 PLIST MAWVG88i B 01234567 O 2016-10-12 14:04:35 EXECUTIONTIME=
This amounts to the following: 64 Bit XBee radio address,
answer to command PLIST,
correlation ID MAWVG88i,
B signaling port address-prefix, parameter 01234567 showing, that 8 output ports are available. Their port addresses are are B0, B1, up to B7.
Date & timestamp as well as the execution time follow. - The response to the read sensor/port configuration request is matched by the correlation Id. This way the system knowns which response belongs to which request.
The least significant position within the correlation Id is incremented - as the length of the configuration varies. Example is:
CORR_CaSOM7xc_andCORR_CaSOM7xd_
BASESTATION findall _No_Param_ aZFzFw3v 2016-02-19 12:50:25is one example where the Base station is querried. This initiates an answer which can vary in length (depending on how many 1-wire sensors and ports are connected to the brick or Base station). The answer is written into directory/var/tmp/sensors/filetrigger/brickconfig.
JSON Data files
The TMOR website visualizes some information obtained by JSON files. You can directly access those JSON files via http and use them for further processing in your own way. The file location on the system is /usr/share/tomcat/webapps/TMOR.
The list below enumerates all the JSON files that can be accessed:
- Holds the status of the communication between Serial and Batch module:
data_result_manage_brick_network_queues.json - Holds the result of the last XBee request:
data_result_manage_brick_network.json - Information displayed on the JSPIndex Page are from the following json files:
- Holds the count of all data points produced by x since day y:
data-points-total.json - Holds the key number for the index page:
data_index_status.json - The following screenshot shows where which JSON file is visualized.
- Holds the count of all data points produced by x since day y:
- Data displayed on the page Values?selectedBrick={BRICK_ID} are held in the following json files:
- Histogram chart data:
data_histogram_{BRICK_ID}.json - Probability density bar chart data:
data_probdensity_{BRICK_ID}.json - Time series of the last 1000 data points:
data_brickvalues_{BRICK_ID}.json
- Histogram chart data:
Uploaded pictures
You have the possibility to upload your own photos and pictures to customize your sensors and ports. The uploaded photos can be found in the following directories:
- The initial upload via Picture Gallery puts the pictures into directory
/usr/share/xbee/picsand/usr/share/tomcat/webapps/TMOR/upload - Once the Presentation Module restarts it copies the pictures from
/usr/share/xbee/picsinto/usr/share/tomcat/webapps/TMOR/upload. By doing so it is made sure that a new version of the application will not erase the users previously uploaded images.
Data download
Via menu point Download the existing values in the data base can be accessed as csv file. Once the download file is ready, the user can download it via the web interface. However, the download files can be found /usr/share/tomcat/webapps/TMOR/downloads.
Once the Presentation module gets redeployed, all the download files will be deleted.
Deployment
TMOR is a modular setup and consists of different software packages (aka as modules) that can be installed seperately. The three main modules are:
- TMOR Presentation Module - a WAR file that is deployed into the TOMCAT Webserver
- Batch Module - a WAR file that is deployed into the TOMCAT Webserver
- Serial Module - a JAR file containing POJOS that runs on the JVM
Note: Use the jar and war files for bugfixes and updates as they keep your database data intact. Installing the ISO file is a clean slate approach that will make you lose the database content. So back up the database beforehand in case you decide to reinstall your TMOR system completely using the ISO file.
TMOR Presentation Module
These are the steps to deploy the TMOR Presentation Module:
1. Download the file TMOR.war form the File Download Section.
In case you download a previous version - rename that downloaded file by removing the version suffix. Only files named TMOR.war will run properly.
2. Access the Tomcat manager of the TMOR basestation with URL http://{YOUR ID ADDRESS}:8080/manager/html. Enter the user and password. Chapter Privacy and passwords provides you with the user and password to access the TMOR basestation web server console.
3. Undeploy the currently running TMOR module by first stopping the web application and then pressing the Undeploy button as shown below:
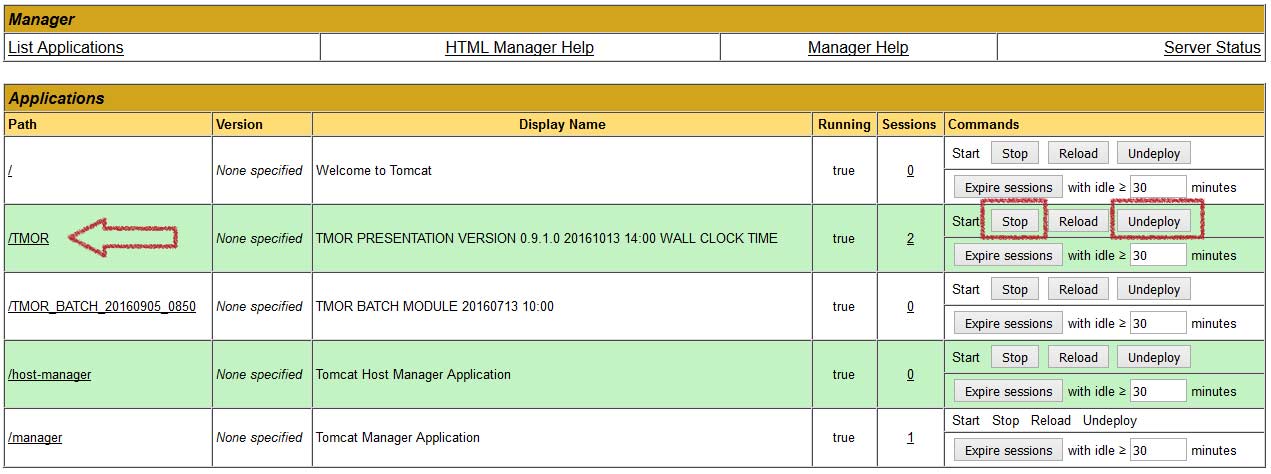
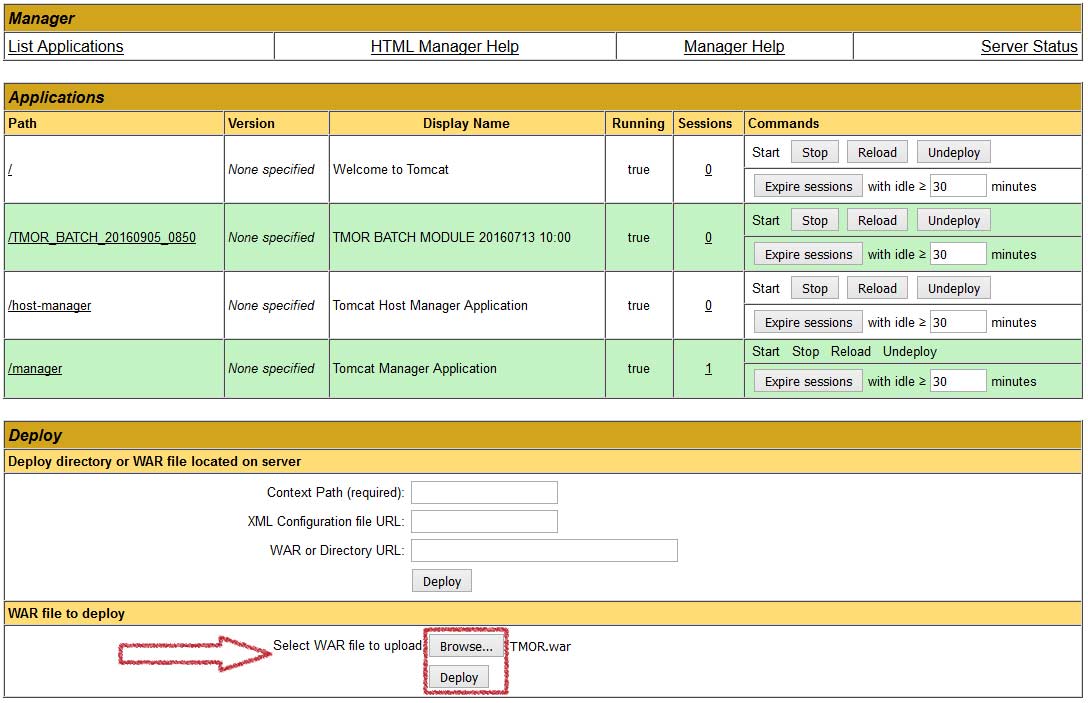 5. Check the result of the deployment. Once the WAR file is uploaded, the following screen should be visible.
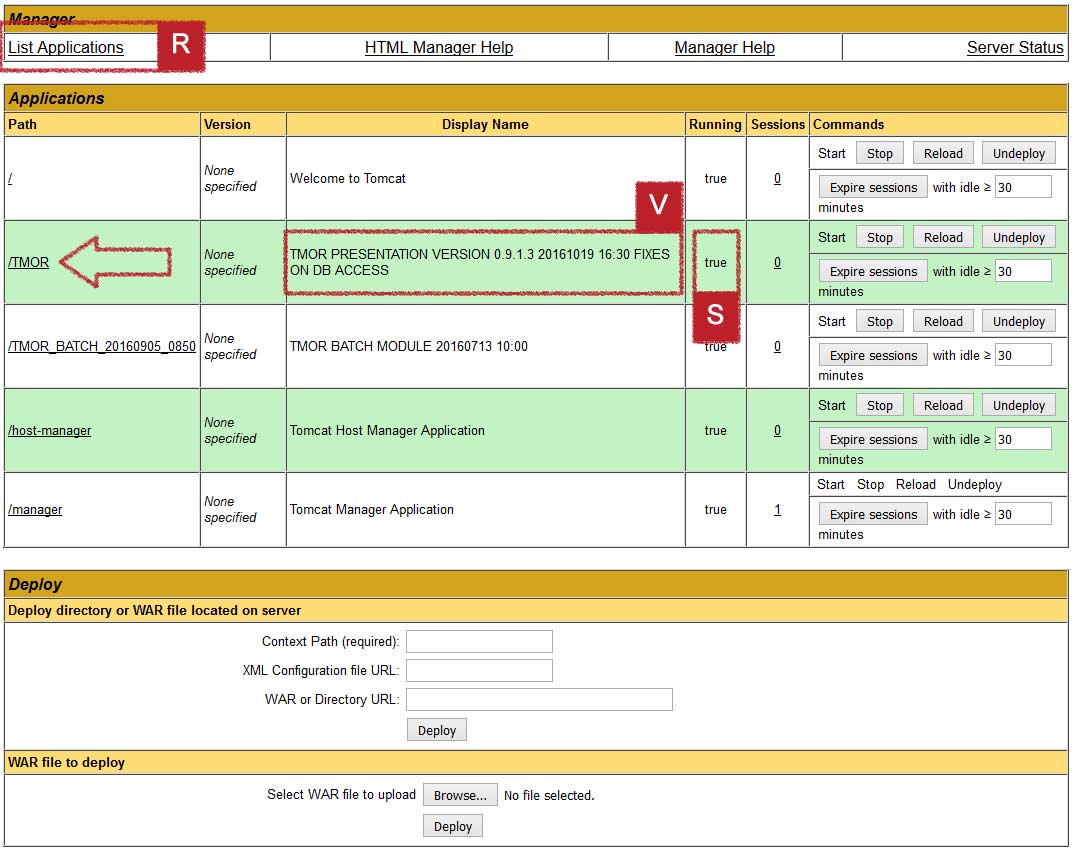
With the successful deployment, the WAR file will be in status running (true in mark S)
A new / different version description should appear in column Displayname (mark V)
The starting up of the TMOR application can be take some time. Check the status by clicking on List Application (mark R)
Once the Tomcat web server admin page shows a successful deployment, check the TMOR web interface by accessing web page
http://{IP ADDESS}:8080/TMOR/Index.
You should expect a Dashboard view similar to this.
TMOR Batch Module
The steps for the TMOR Batch Module deployment are almost identical to the ones described for the TMOR Presentation Module. Below are the differences between the deployment of the two war files highlighted.
1. Download the file TMOR_BATCH##{VERSION}.war form the File Download Section.
Keep the filename as it is, as it contains the version number of the Batch Module.
2. Access the Tomcat console of the TMOR basestation with URL http://{YOUR IP ADDRESS}:8080/manager/html. Enter user and password.
In case there are problems with the user credentials, refer to chapter Privacy and passwords for more details.
3. Undeploy the currently running TMOR Batch Module by first stopping the application (mark 1) and then pressing the Undeploy button as depicted below:
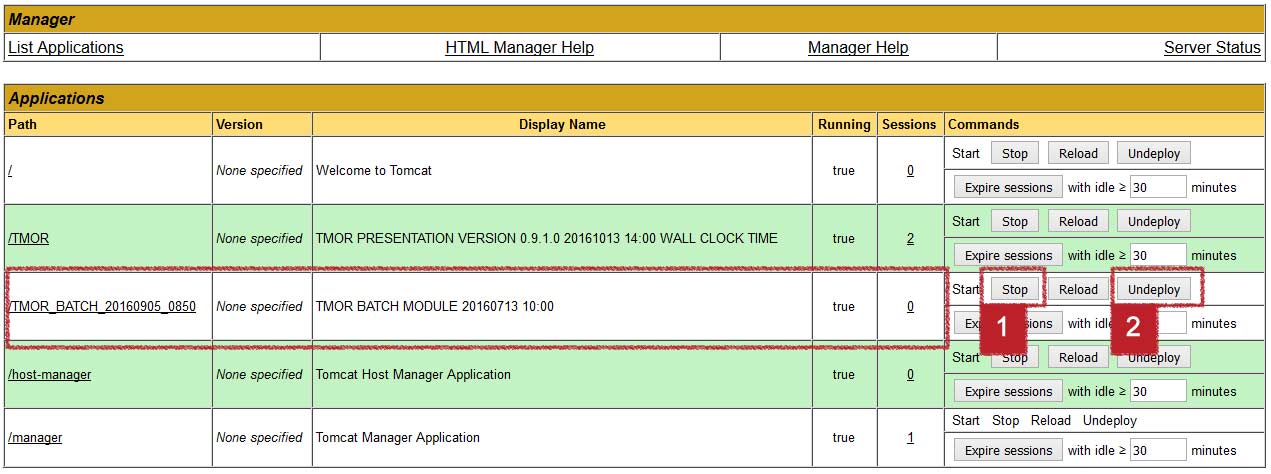
TMOR_BATCH##{VERSION}.war which was downloaded in step 1. Depending on your internet connection to the TMOR RasPi, the upload process might take some time. 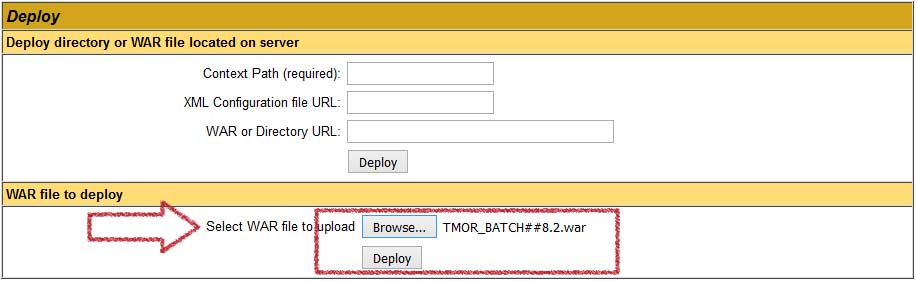 5. Check the result of the deployment. Once the WAR file is uploaded, the following screen should be visible.
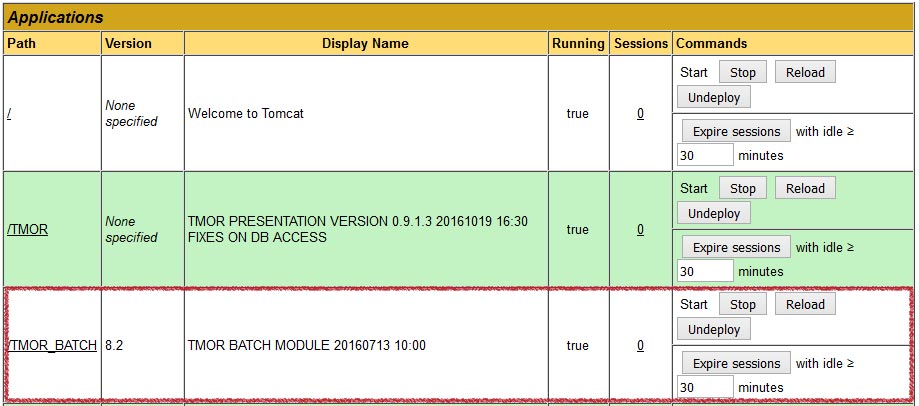
With the successful deployment, the WAR file will be in status running and the version and description will reflect the newly deployed batch module.
As the TMOR Batch Module does not provide a web user interface, one needs to check the application log file
sensors_batch_module_roll.log
see chapter Log files for more information or wait for the next batch run to happen and to check the updated values.
Raspberry SD Card preparation
The download section offers TMOR as iso image for an SD Card. Choose the Wheezy version if you have a Raspberry Version 2.
If the target platform is a Raspberry Version 3, then download the Jessie version.
In case you want to run TMOR on a Asus Tinker board then follow the chapter SD Card preparation Asus Tinker.
The following steps explain how to get from the downloaded iso file to a running TMOR system.
1. Determine which iso file matches your RasPi version - The support matrix in the Base station section helps you make a choice
2. Download the right version from the download section
3. Write the iso image to an empty SD card using a software such as Win32DiskImager
4. Follow the instruction in chapter Get started - Base station
5 A. Raspberry V3 only: Before expanding the file system make sure to create the flag file /usr/share/xbee/xbee_status_connected to avoid a subsequent reboot
5 B. Expand the file system to the whole SD card by using sudo raspi-config in the console
Or skip the whole trouble and choose our EasyPlan. Everything is ready - you only need to switch TMOR on.
Asus Tinker SD Card preparation
The download section offers TMOR as iso image for an SD Card.
The following steps explain how to get from the downloaded iso file to a running TMOR system.
1. Determine which iso file matches your Asus Tinker version - The support matrix in the Base station section helps you make a choice
2. Download the right version from the download section
3. Write the iso image to an empty SD card using a software such as Win32DiskImager
4. Follow the instruction in chapter Get started - Base station
5. Asus does not provide any admin tool to expand the file system. Therefore follow these manual steps:
5 A. Check the free size of the SD card with df -h. The result should look similar to the seen below:
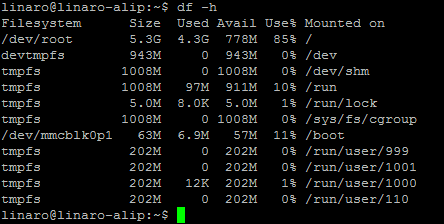
5 B. Call the disk partition program withsudo fdisk /dev/mmcblk0. Then press p to display the partitions.
Note down the start sector of the second partition. In this case its the number 139264.
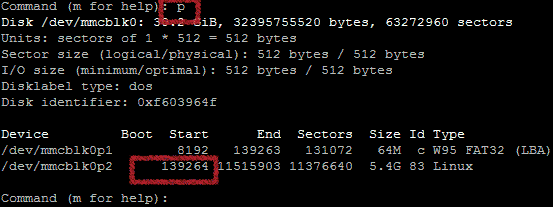
5 C. Now delete partition 2 by pressing d and then 2. Once the partition is deleted we create create a new one.
5 D. The new partition must be a primary partition - type p then press 2 for the partition number.
Once the partition is deleted we create create a new one. Press n for new and p for primary. Enter 2 for the partition number.
Now enter the starting sector which you noted in step 5 B as start sector. In our case its 139264. The last sector is default - so press return key.
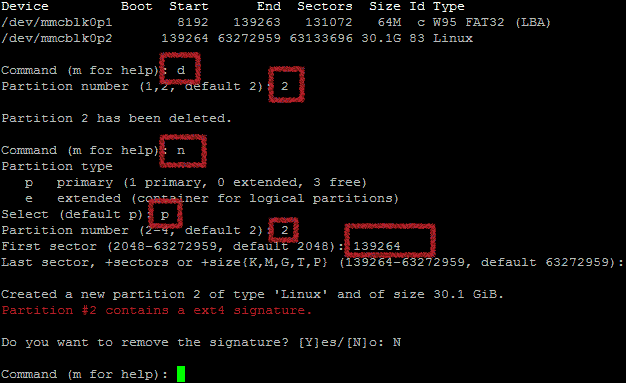
5 E. In a final step the newly created partition must be written - type w.
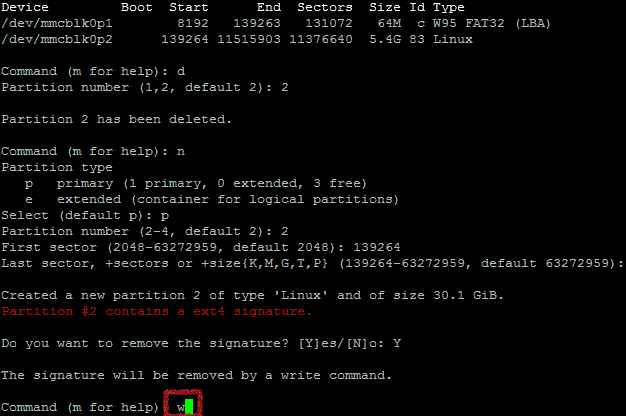
5 F. You might encounter an error message as displayed below. This can be ignored.
Now reboot the TMOR base station by entering sudo reboot now
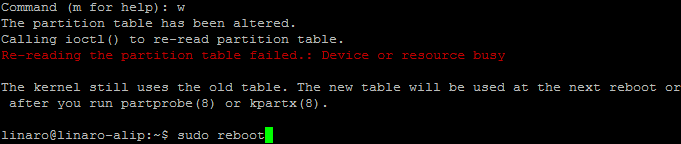
5 G. After the successful reboot resize the disk by typing sudo resize2fs /dev/mmcblk0p2.
A check on the disk size df -h shows the result.
Wrap the operation up with a final reboot sudo reboot now.
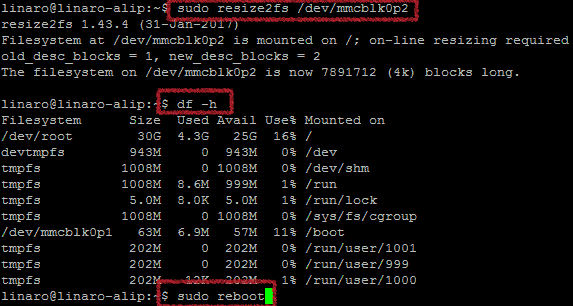
Or skip the whole trouble and choose our EasyPlan. Everything is ready - you only need to switch TMOR on.