Introduction
Why performance tests?
Performance has an immediate impact on usability. What is the system doing? How long do I have to wait until the requested page is loaded? The answer to such questions helps managing expectations - esp. as TMOR is based on low cost hardware, but aiming at tasks that are quite system demanding (e.g. Big Data, near real time IoT , etc.).
Performance tests deliver results that give an indication about the expected average load time of a specific web page. Along with the release of a mayor TMOR release we planned to release a performance report. This report also helps identifying bottle necks and improvement potentials for further releases.
Methodology applied
While conducting performance measurements it is imperative to keep side effects and disturbances, which might influence the test result, as small as possible. However, the TMOR system is normally employed in an everday environment. We therefore had to strike a compromise between recording the "real" performance characteristics of TMOR in a sterile lab environment, as well as allowing for a test environment which to some degree reflects the normal operation surroundings. These were the measures taken to balance the two extremes:
- The test setup is in a intranet with sufficient bandwidth to minimize network load and latency effects
- No user interaction with the TMOR systems participating in the performance test
- Benchmark systems had the automatic OS software update disabled
- Raspberry Pi Version - Single Core (Raspi2) vs Quad Core (Raspi3)
- SD Card employed - memory cards are classified with different read/write speeds
- Data amount in the TMOR database
The performance tests are conducted by using a test program which pretends to be a normal user requesting web pages via a web browser such as Firefox or IE. The time duration used from initial page request to receiving the whole page is measured. The data received is then validated, so to make sure that the page requested is really the correct server answer and not just an error page (such as a 404 error) which loads quite qickly. The collected results are then further analyzed using Excel and statistical software. Outliers are deleted from the sample. The results can be seen below.
User screens involved
Performance testing is time intensive. First, one needs to setup the test infrastructure and then conduct the tests. After the tests are run, the recorded data needs to be combed and analyzed. So we do not performance test each single functionality of TMOR, but rather selected a set of screens, which in turn use different functions - functions which are used by other user screens, which are not included in the performance test. These are user screens tested:
- The Event Log page presents the list of files in the directories responsible for communication with the Serial Module. It does not need much CPU power to assemble this page. However, the file access to the file system is most significant for the results of this task.
- The Index page presents a variety of data to the user. The data is collected from the file system, as well as the TMOR data base. Little calculation is performed.
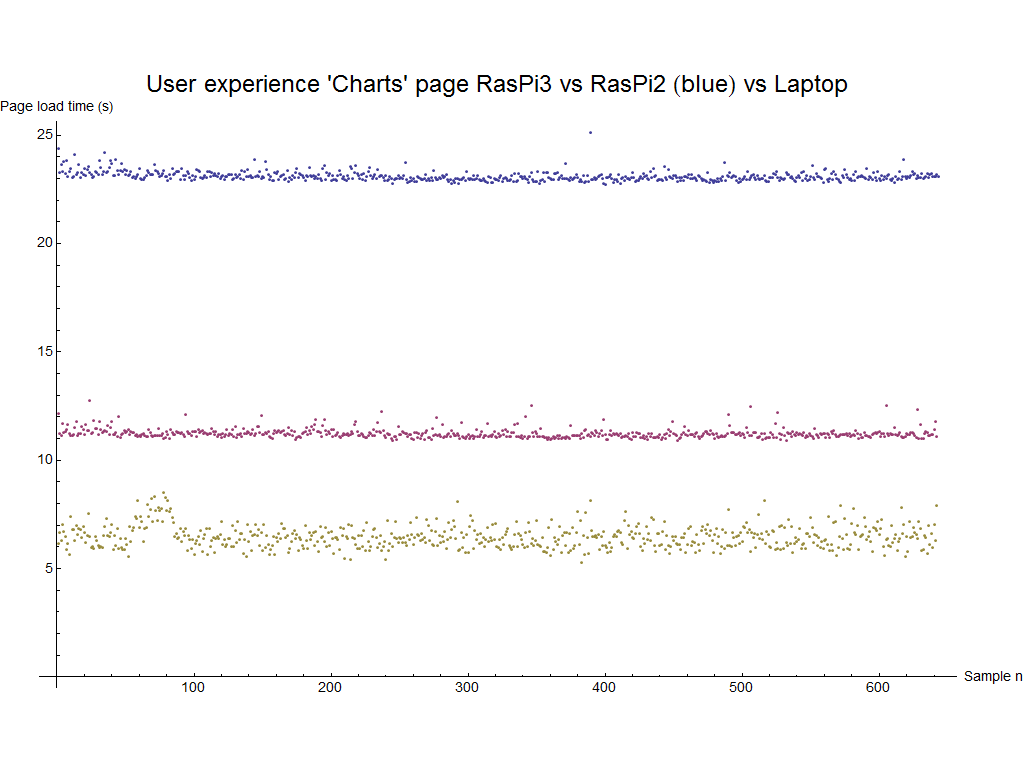
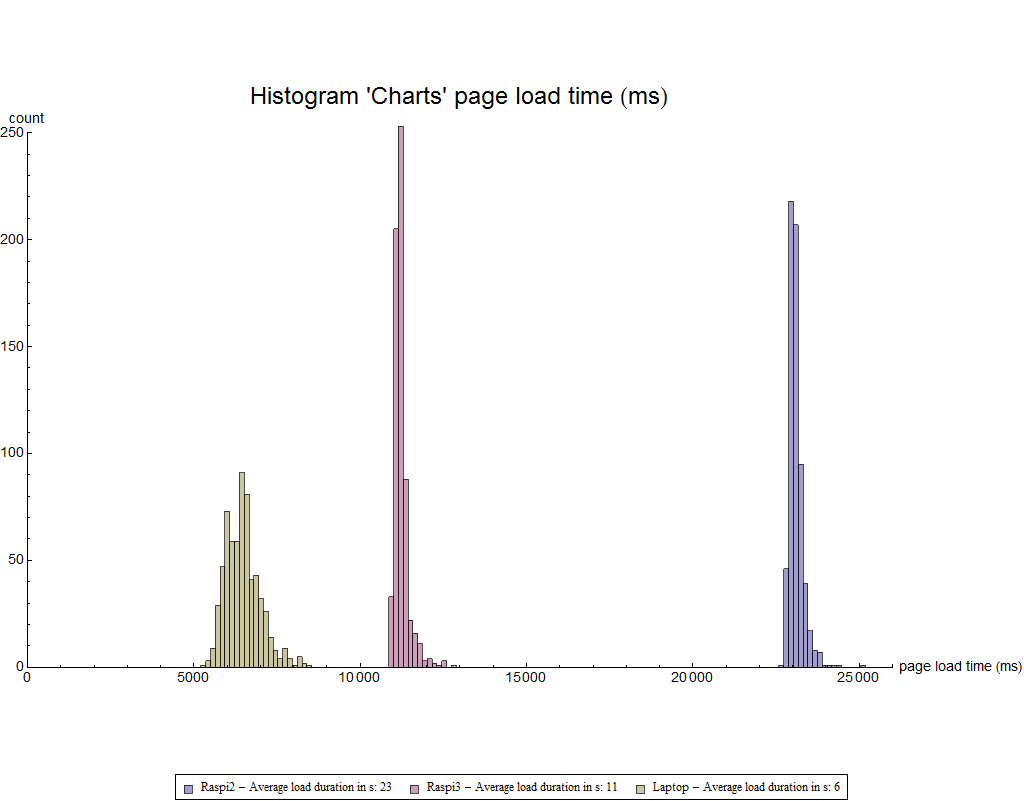
- The Charts page queries huge data volumes from the data base and renders it into json files which are presented to the user as graphs. This task relies on database efficiency and CPU power.
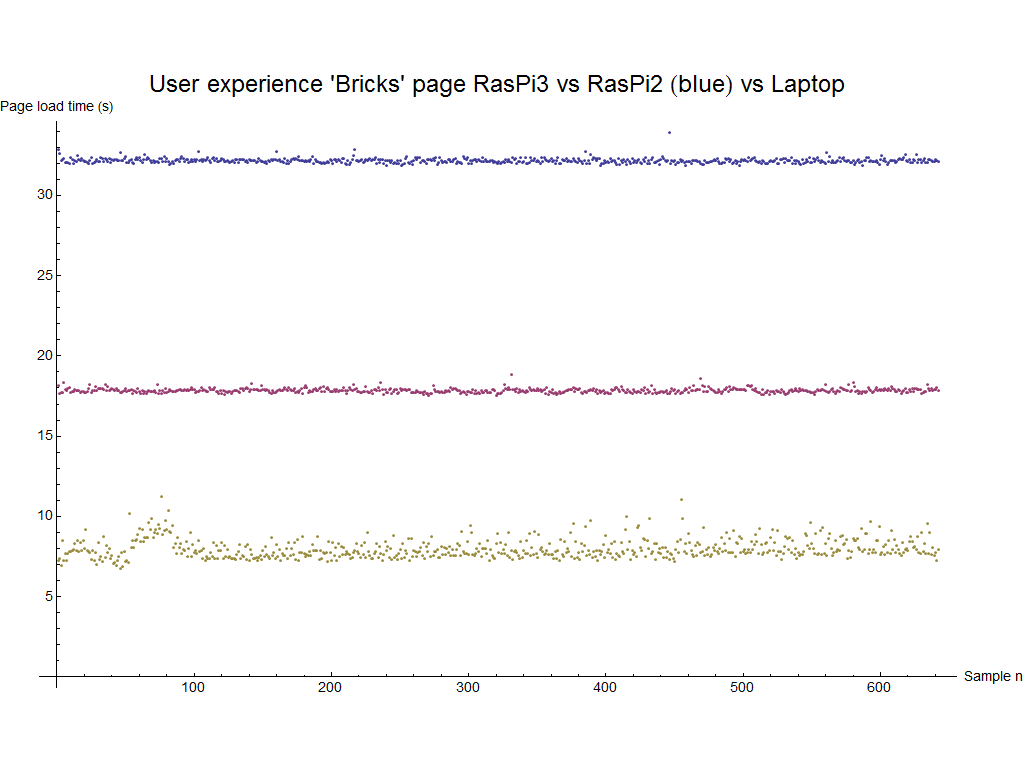
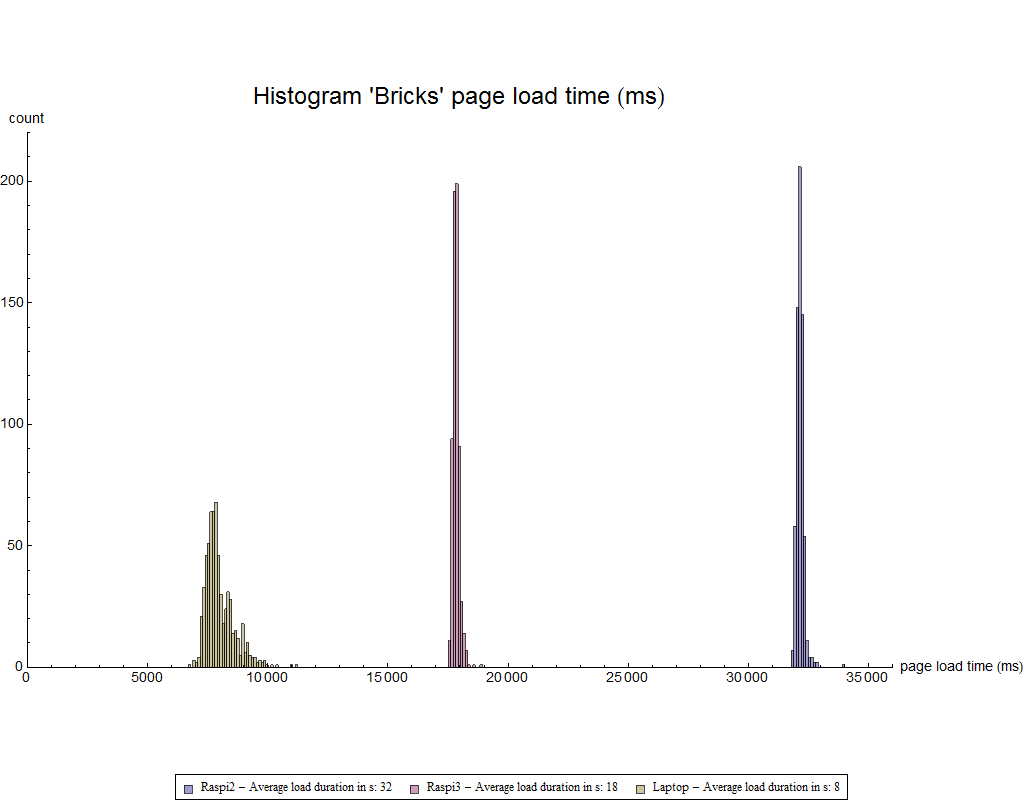
- The Bricks page queries huge data volumes from different data base tables. The db query results are translated into HHML tables. Database efficiency and to some degree CPU power are key to the performance of this task.
Release V1 19.11.2016
Performance test setup for Release V1
| Test participant | SD Card/Memory | TMOR data base count | Color code |
|---|---|---|---|
| Rapberry PI2 TMOR Wheezy | 32 GB Ultimate 633x Transcend - Class 10 | approx. 658000 | Blue |
| Rapberry PI3 TMOR Jessie | 32 GB Ultimate 633x Transcend - Class 10 | approx. 655000 | Mangenta |
| Year 2012 Laptop i5 - Windows 7 | SSD & 4 GB RAM | approx. 635000 | Olive |
The four user screens where called on each test participant over 642 times. In total the test results encompass 3 test participants * 4 TMOR html pages * 642 page loads = 7704 page load times. The test execution was conducted over 2 days.
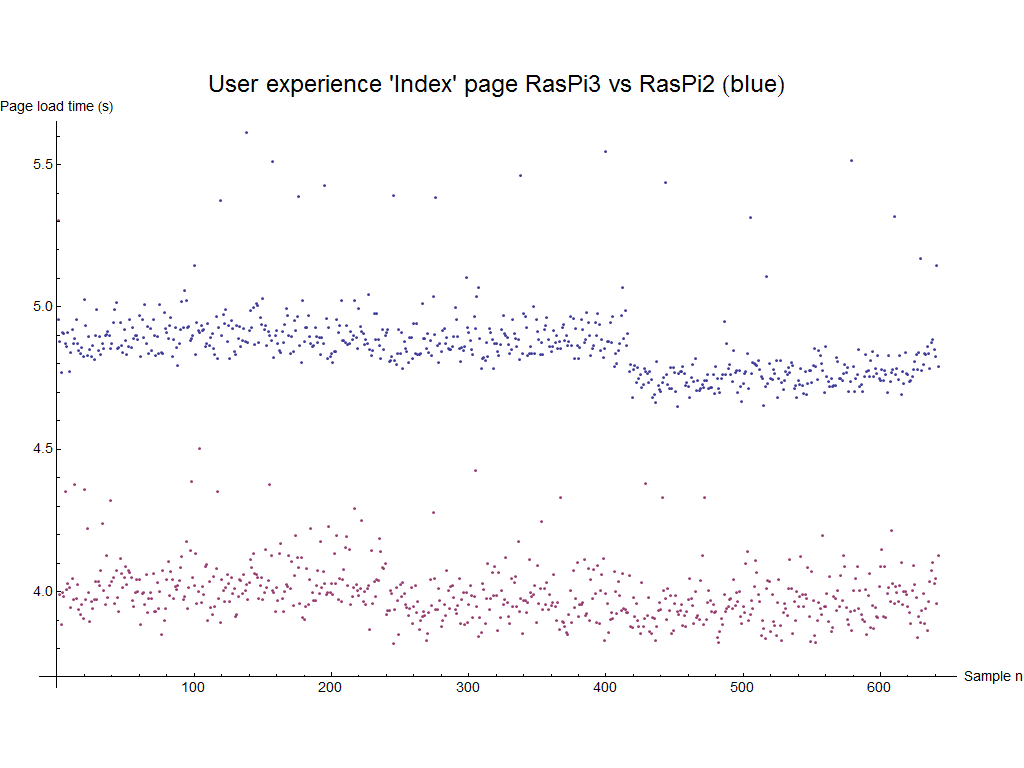
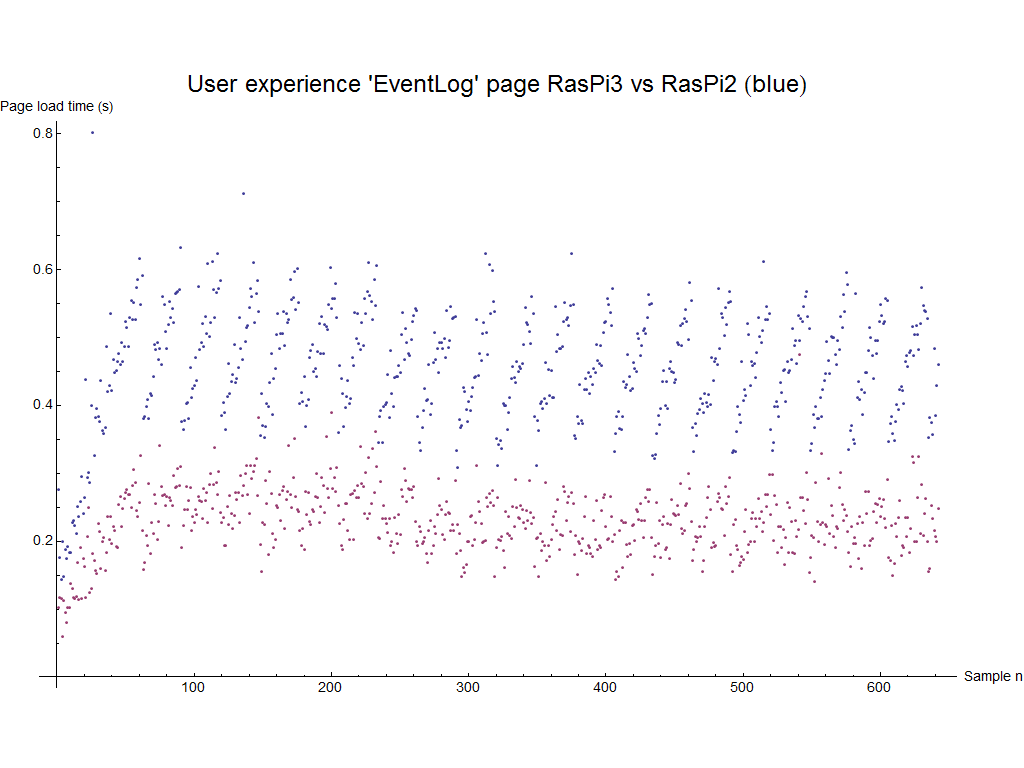
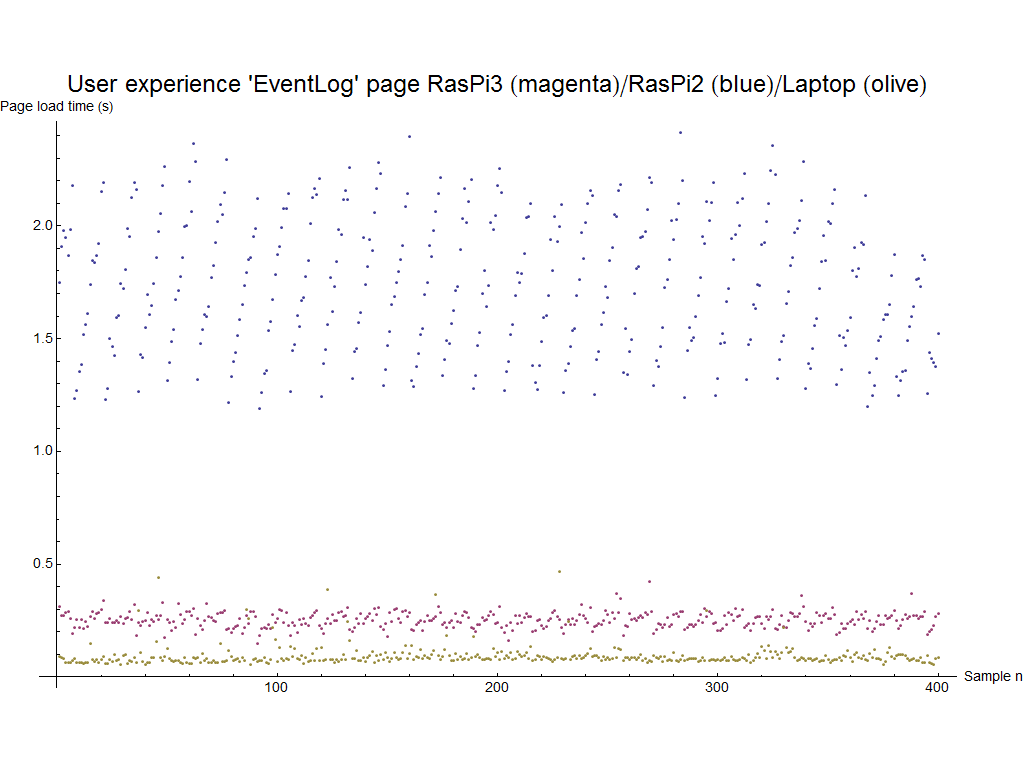
The list plots below shows the 2 * 642 calls to two different TMOR systems. The samples are in chronological order (e.g. sample no. 1 was obtained at the test begin and sample 642 was the last sample).
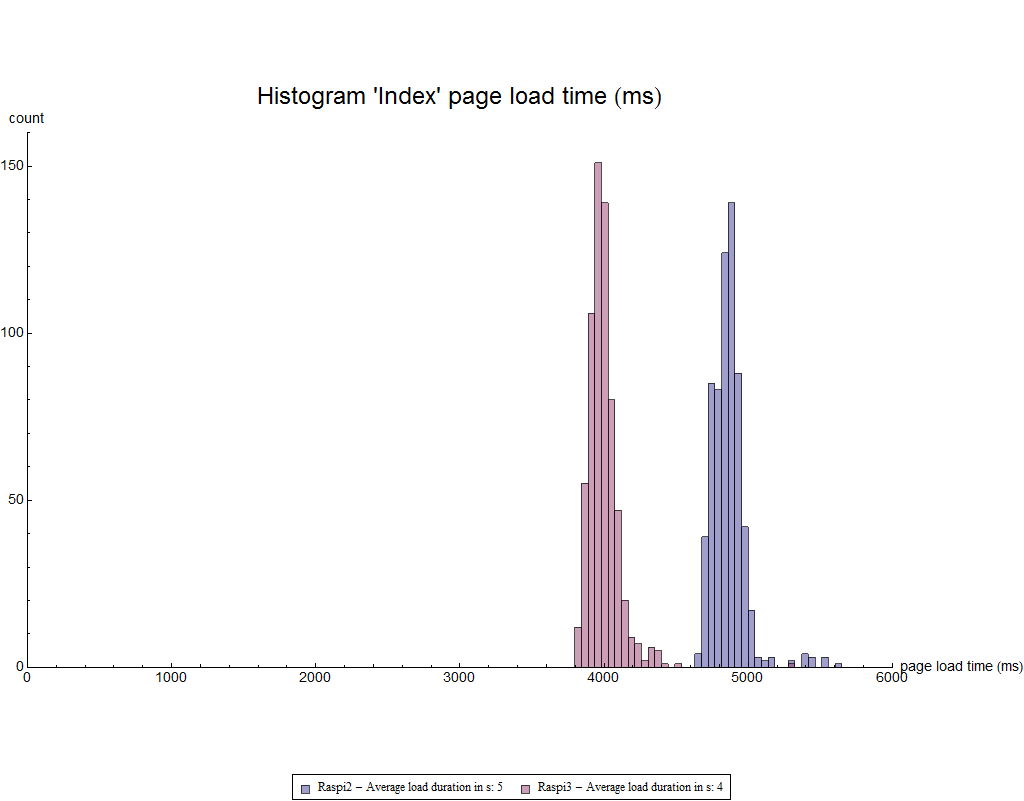
Page Index
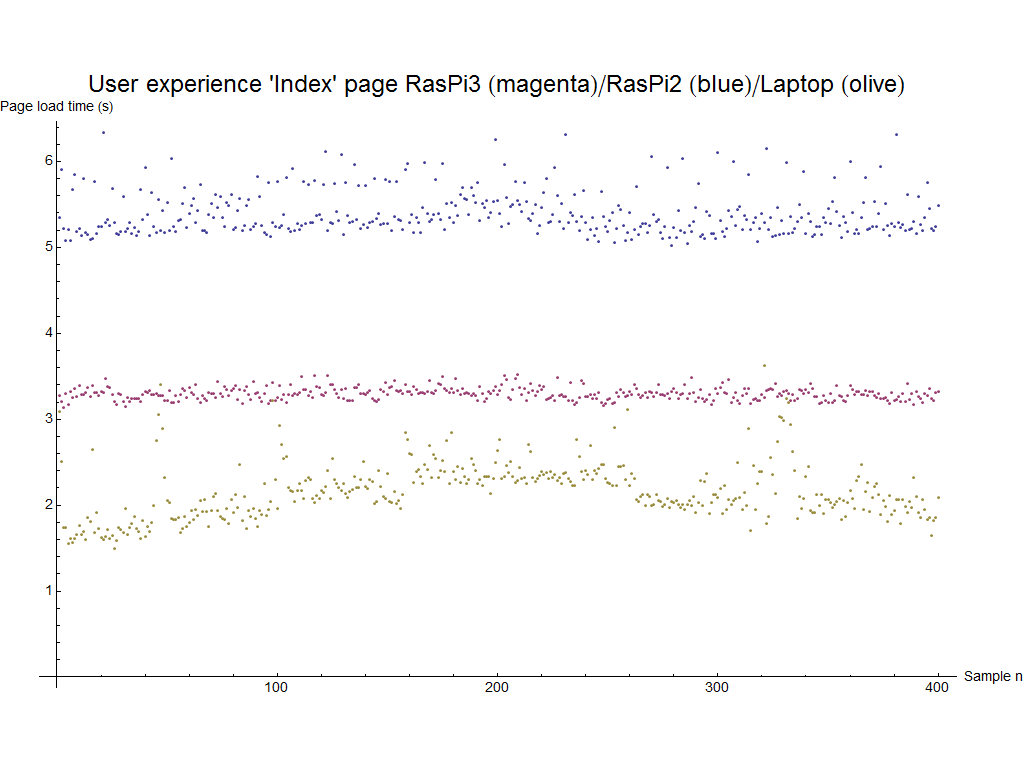
The following grap shows, that the variance in the Index page response time is quite large.
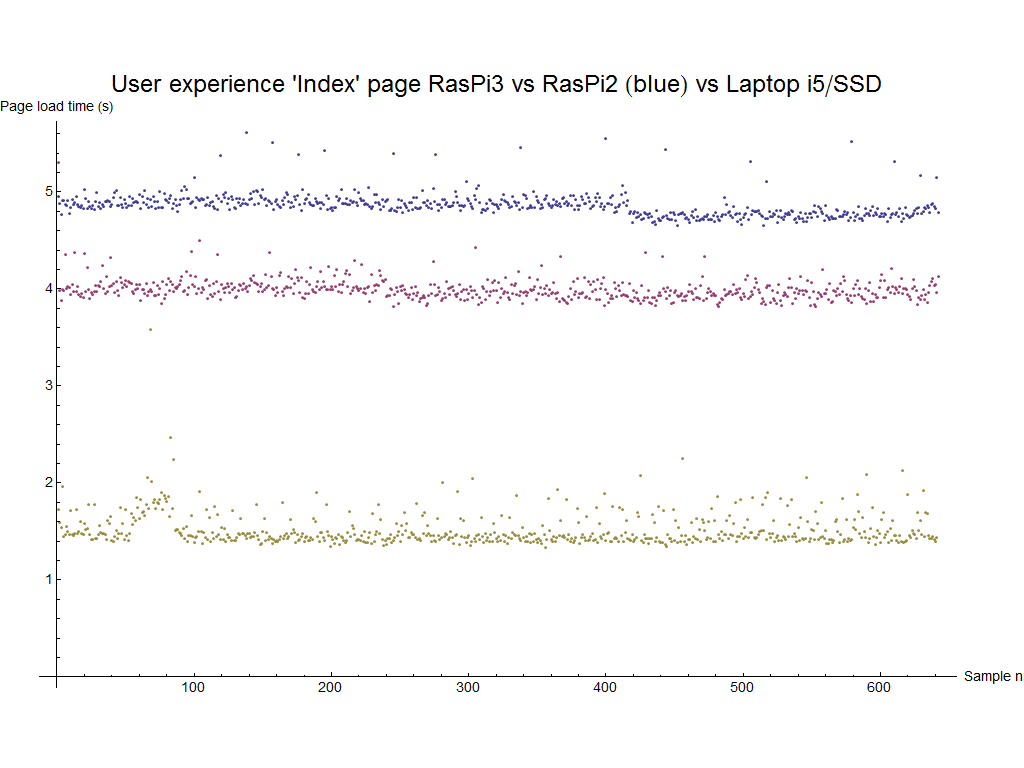
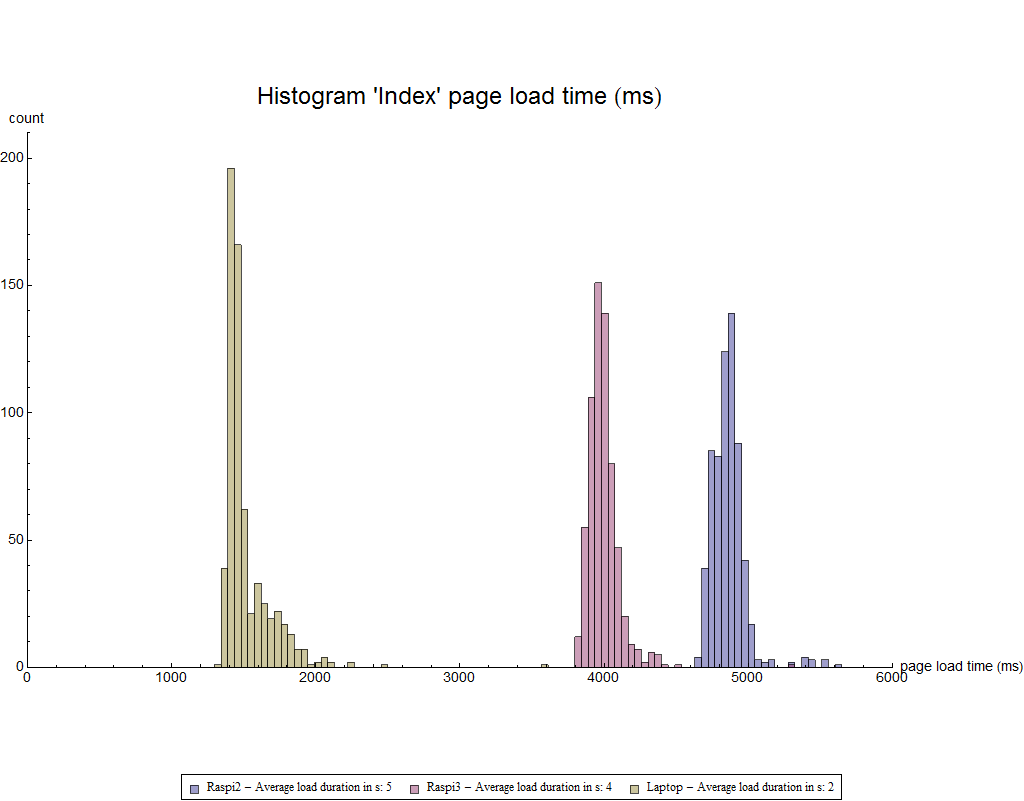
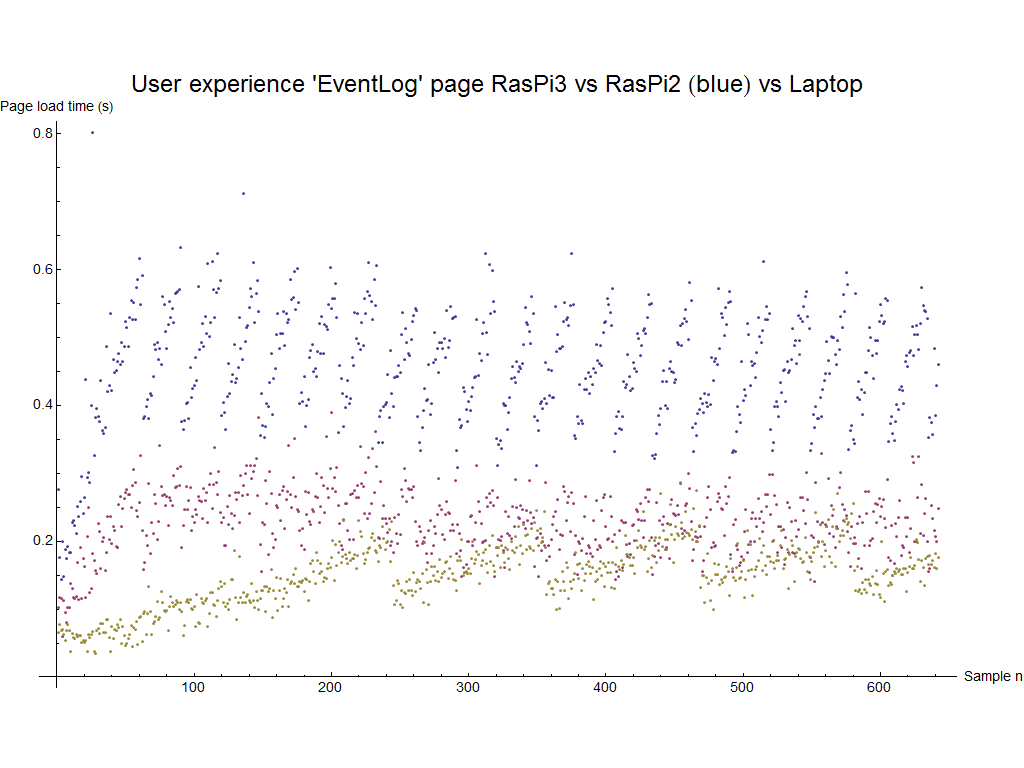
These graphs put the performance of the two Raspi systems in perspective to the one of a laptop.
Page Bricks
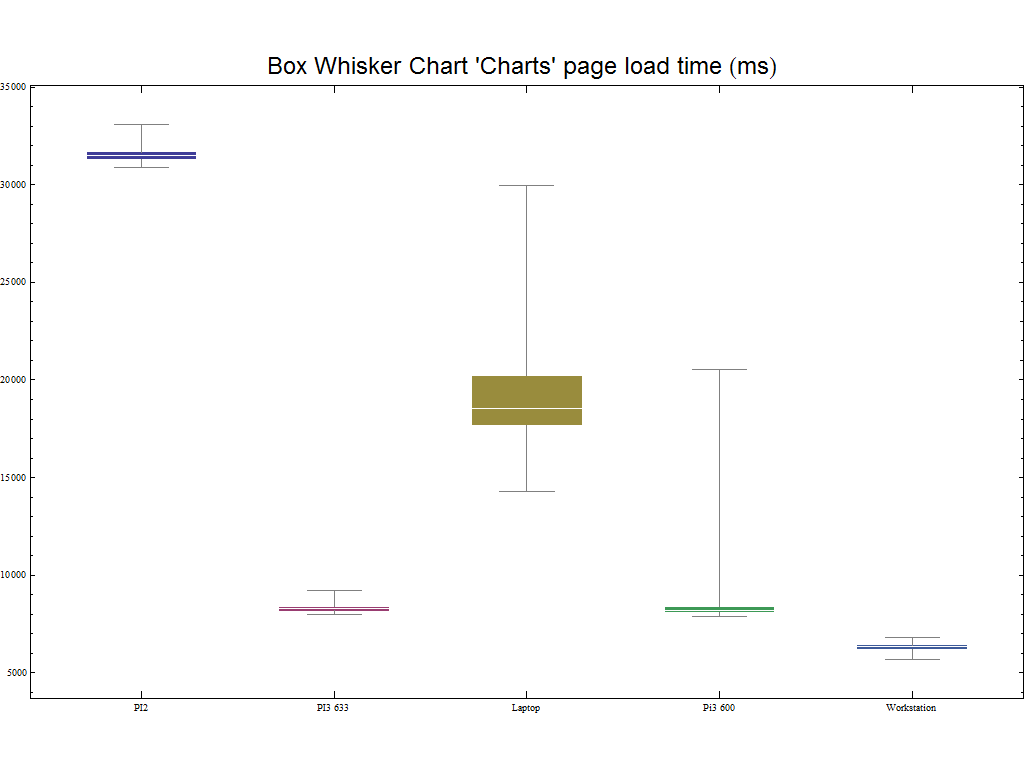
Page Charts
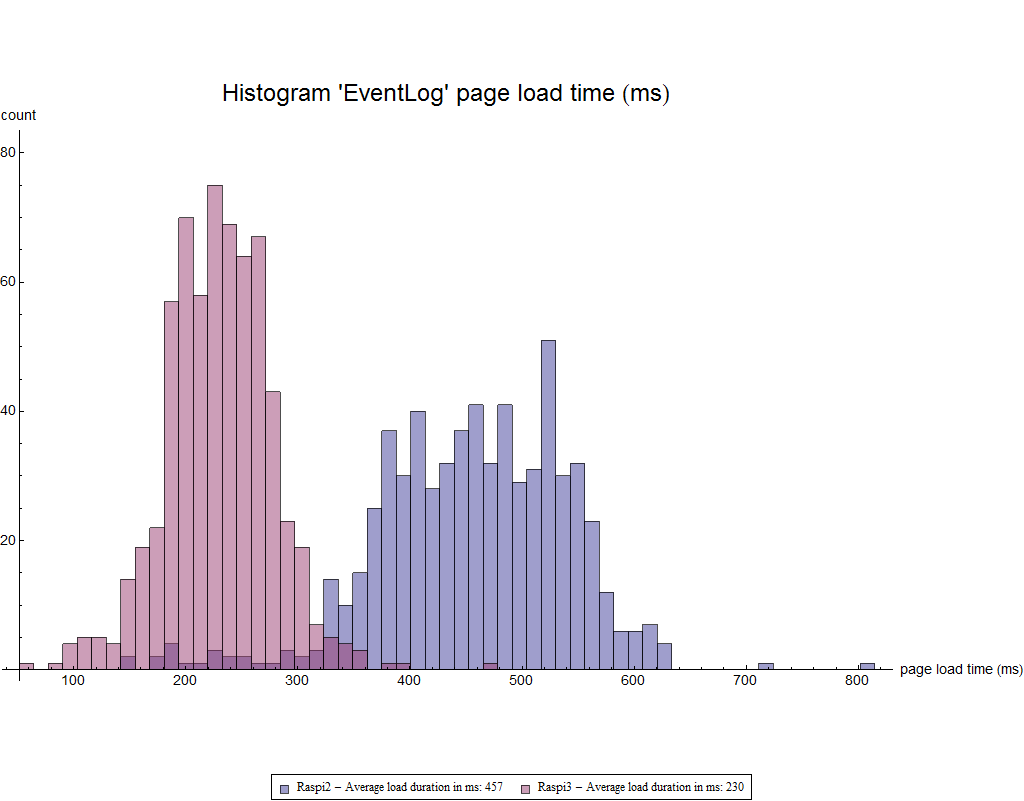
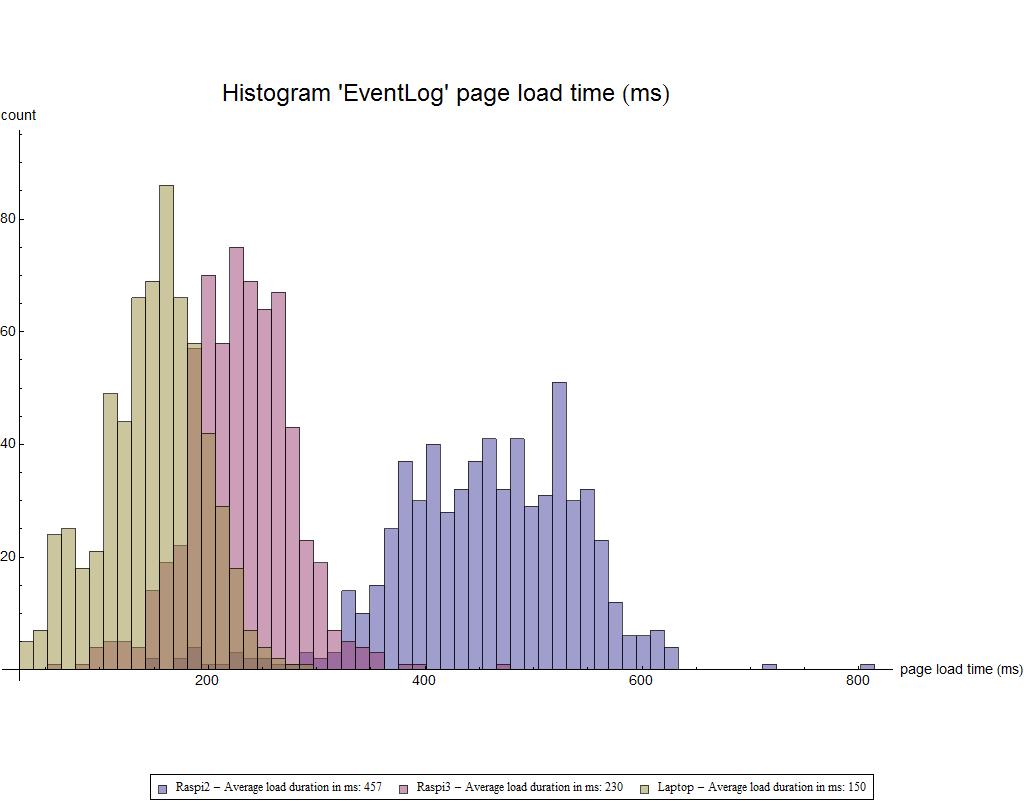
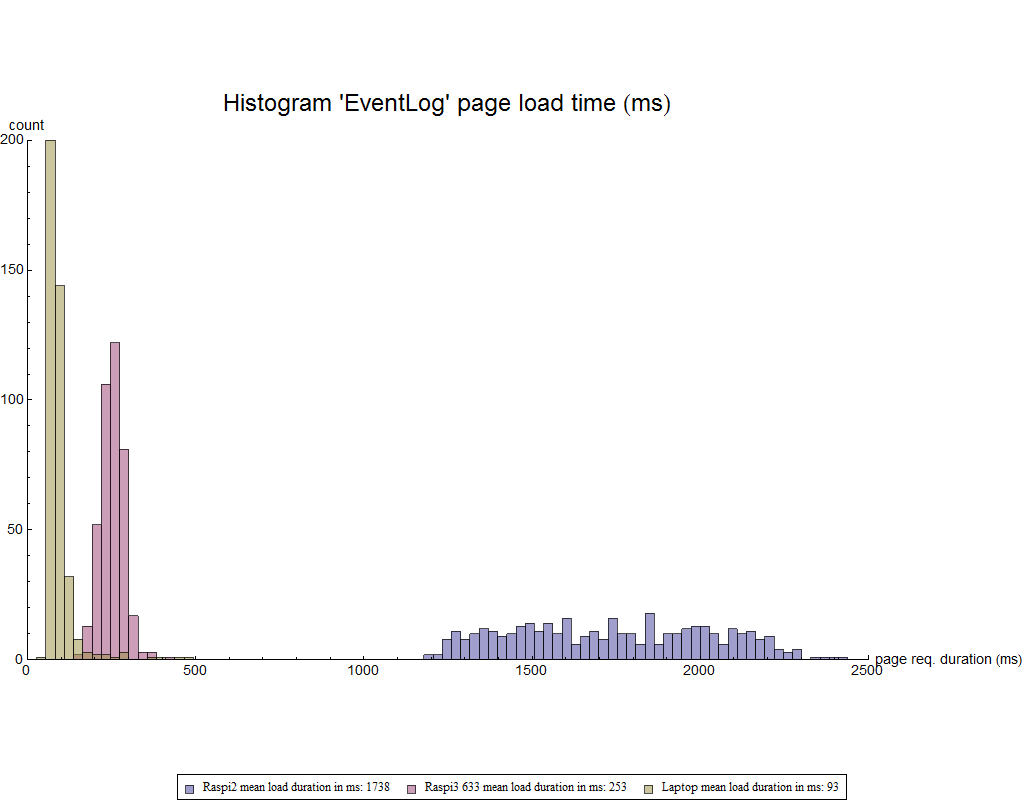
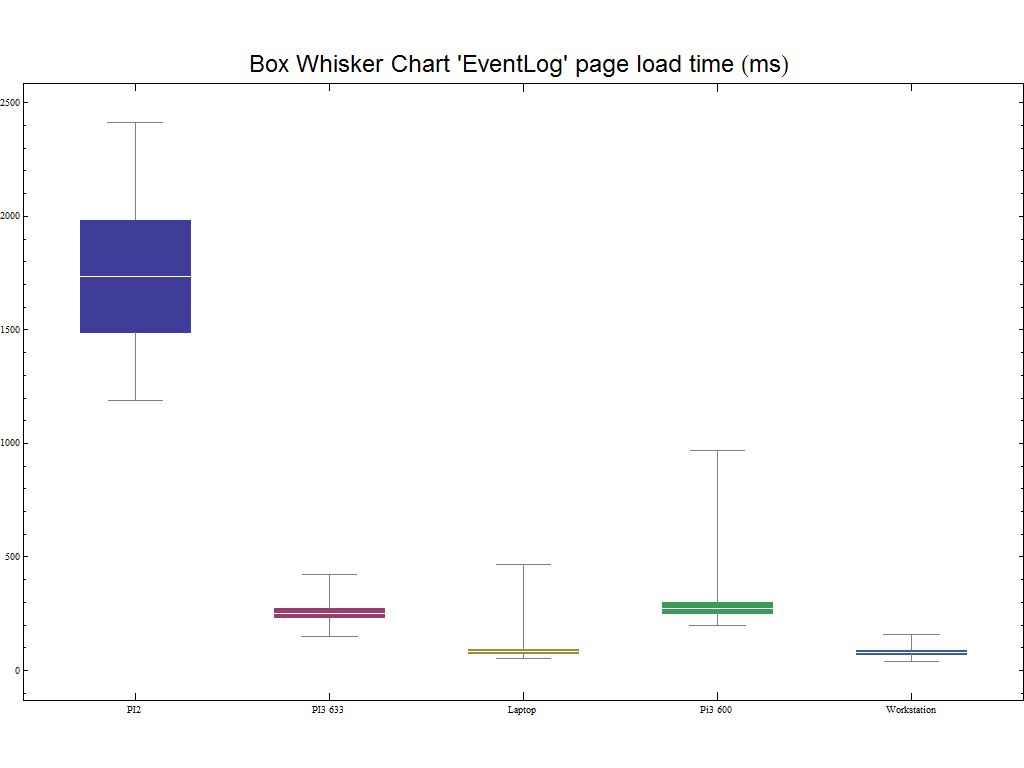
Page Event Log
Conclusion
A summary of all average page load times is displayed in the table below:
| Test participant | Index | Bricks | Charts | Event Log |
|---|---|---|---|---|
| Rapberry PI2 TMOR Wheezy 32 GB Ultimate 633x Transcend | 5 sec | 32 sec | 23 sec | 457 ms |
| Rapberry PI3 TMOR Jessie 32 GB Ultimate 633x Transcend | 4 sec | 18 sec | 11 sec | 230 ms |
| Year 2012 Laptop i5 - Windows 7 | 2 sec | 8 sec | 6 sec | 150 ms |
As expected, CPU power determines the page load time of all four specimen pages. A laptop from the year 2012 is, roughly speaking, twice as fast as the quad core PI3. Index and Event Log page provide a good user experience while the Charts page is at the limit. The Bricks page with its 18, resp. 32 sec. is the slowest. Some investigation on code level might shed light on the reasons for the high response time.
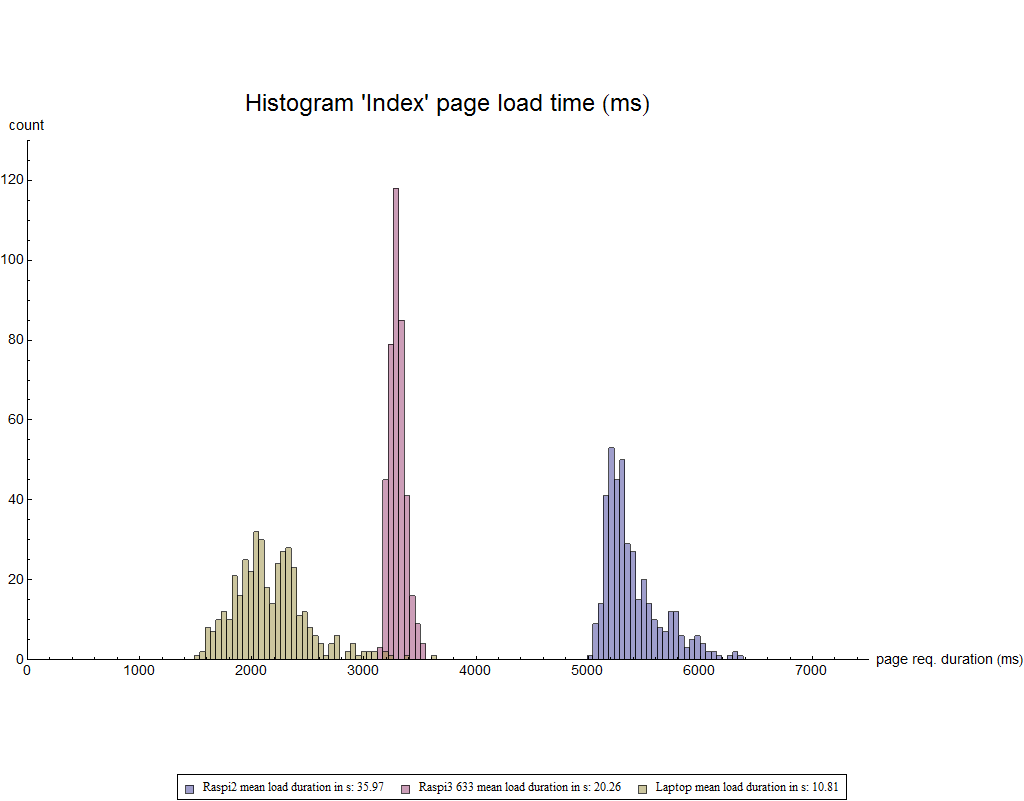
The Event Log page mainly tests the file system speed. By looking at the histogram we can assert, that the Laptop is not superior to the Raspi3 page load times. Therefore a further point of investigation is the SD card and its impact on user experience.
Release V2 19.05.2017
Performance test setup for Release Version 2
| Test participant | SD Card/Memory | TMOR data base count | Color code |
|---|---|---|---|
| Rapberry PI2 TMOR Wheezy | 32 GB Ultimate 633x Transcend - Class 10 | approx. 664000 | Blue |
| Rapberry PI3 TMOR Jessie | 32 GB Ultimate 633x Transcend - Class 10 | approx. 641000 | Mangenta |
| Year 2012 Laptop i5 - Windows 7 | SSD & 4 GB RAM | approx. 641000 | Olive |
| Rapberry PI3 TMOR Jessie | 32 GB Ultimate 600x Transcend - Class 10 | approx. 641000 | Green |
| Year 2015 Workstation i7 - Windows 7 | SSD & 32 GB RAM | approx. 641000 | Lighter Blue |
The four user screens where called on each test participant over 400 times. In total the test results encompass the 3 old test participants * 4 TMOR html pages * 400 page loads = 4800 page load times. The test execution was conducted over 2 days.
In addition to the three old tests systems (already used in test for Version 1), we introduce two new ones.
Note: We added two more system configurations, in oder to answer the following to questions:
- How important is the SD Card on the RasPi 3 system?
- How much faster is a Pentium i7 system compared to the i5 Laptop?
Page Index
The following grap shows, that the variance in the Index page response time is quite large.
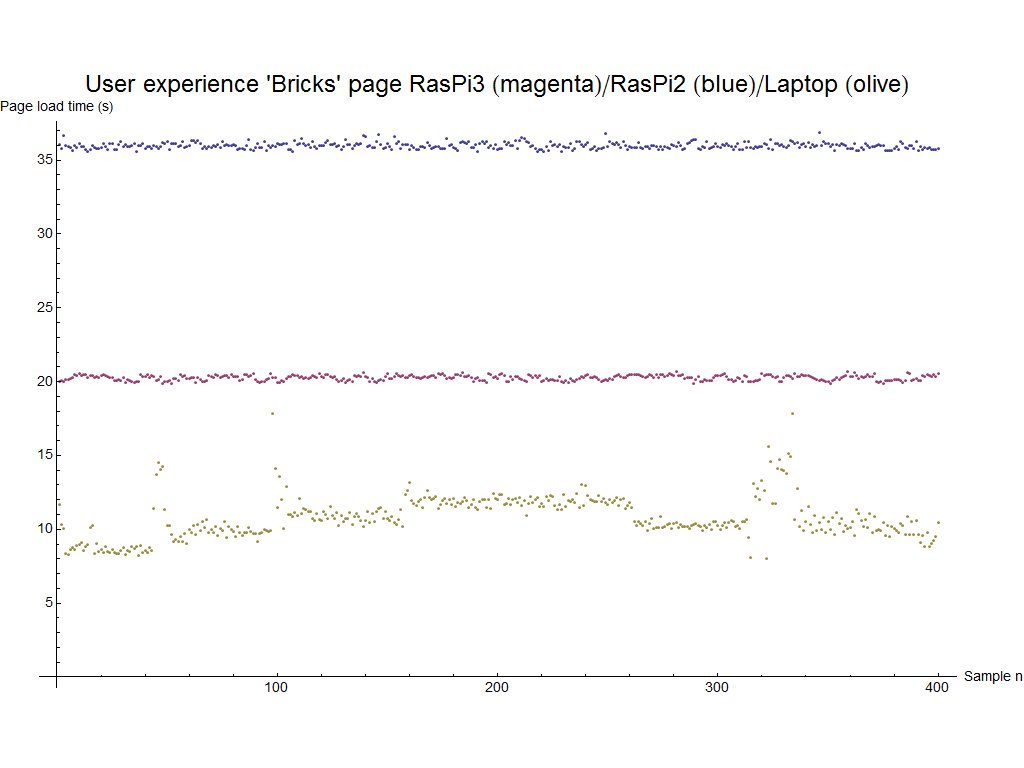
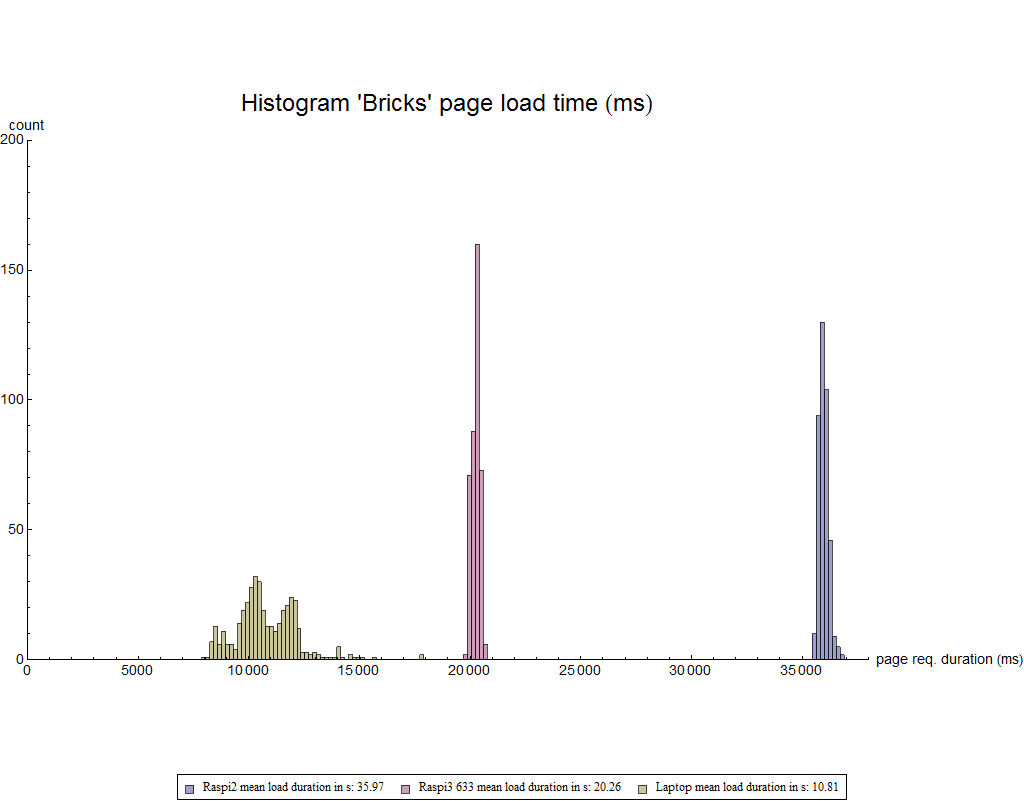
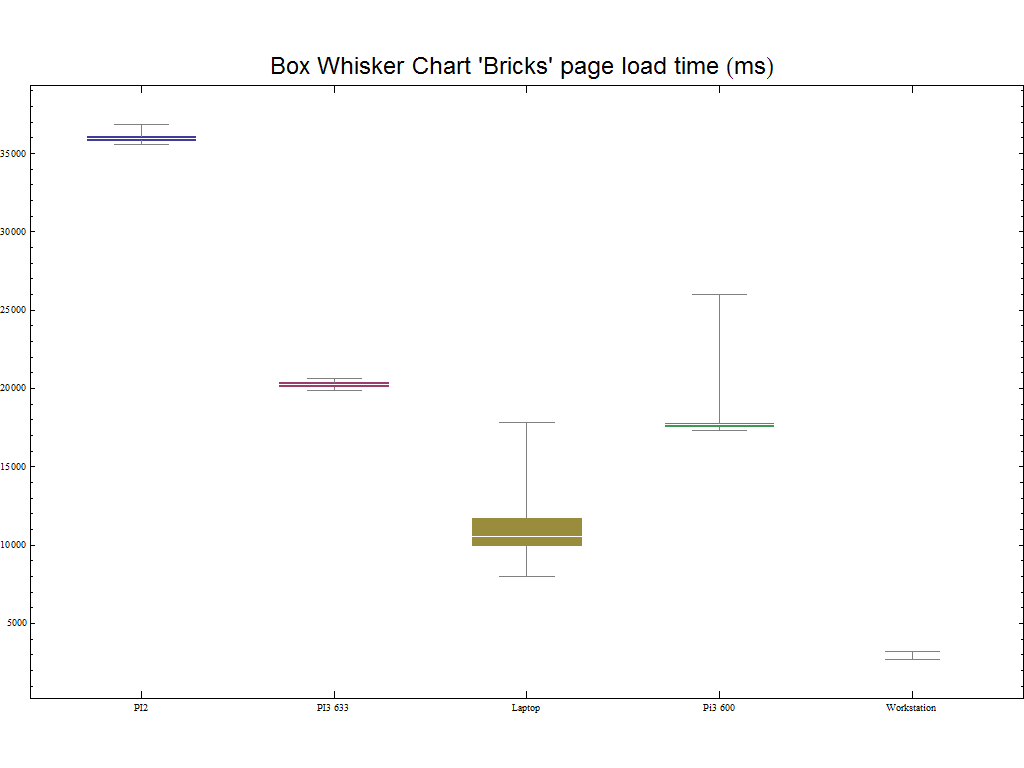
Page Bricks
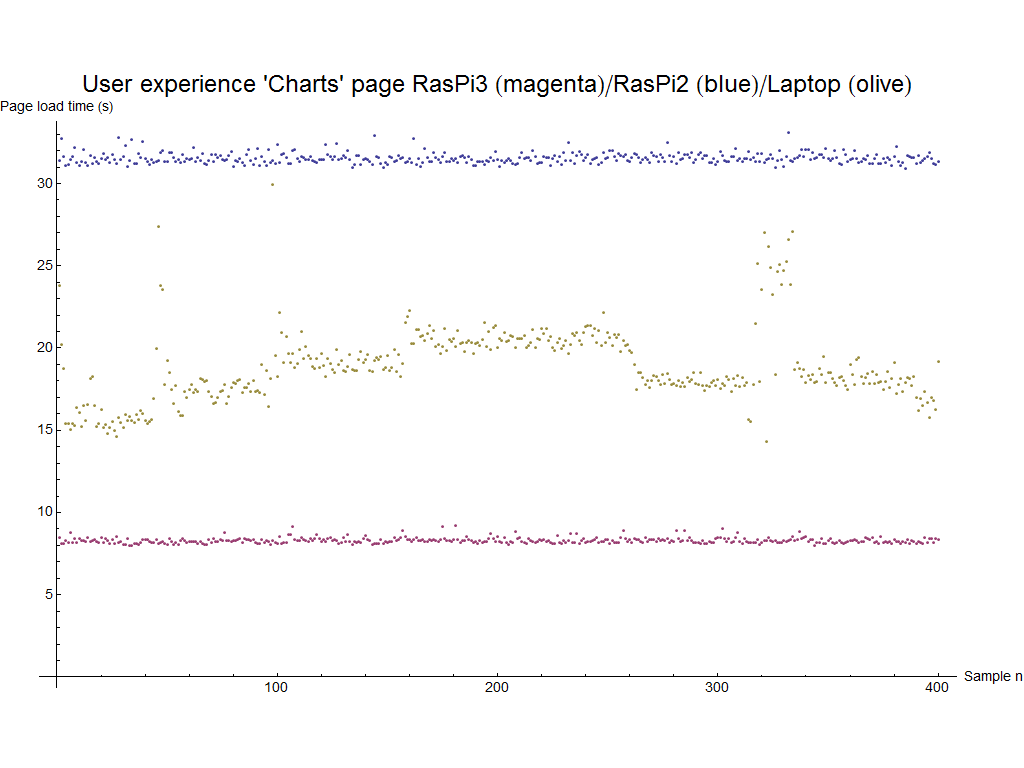
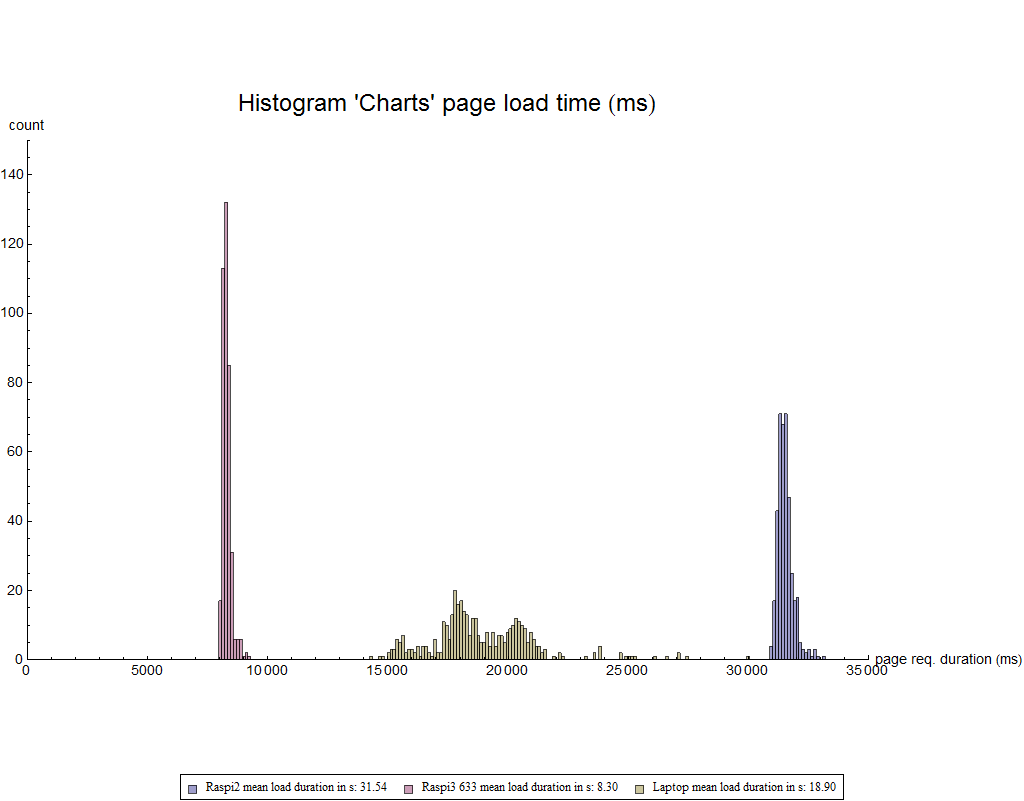
Page Charts
Page Event Log
Conclusion
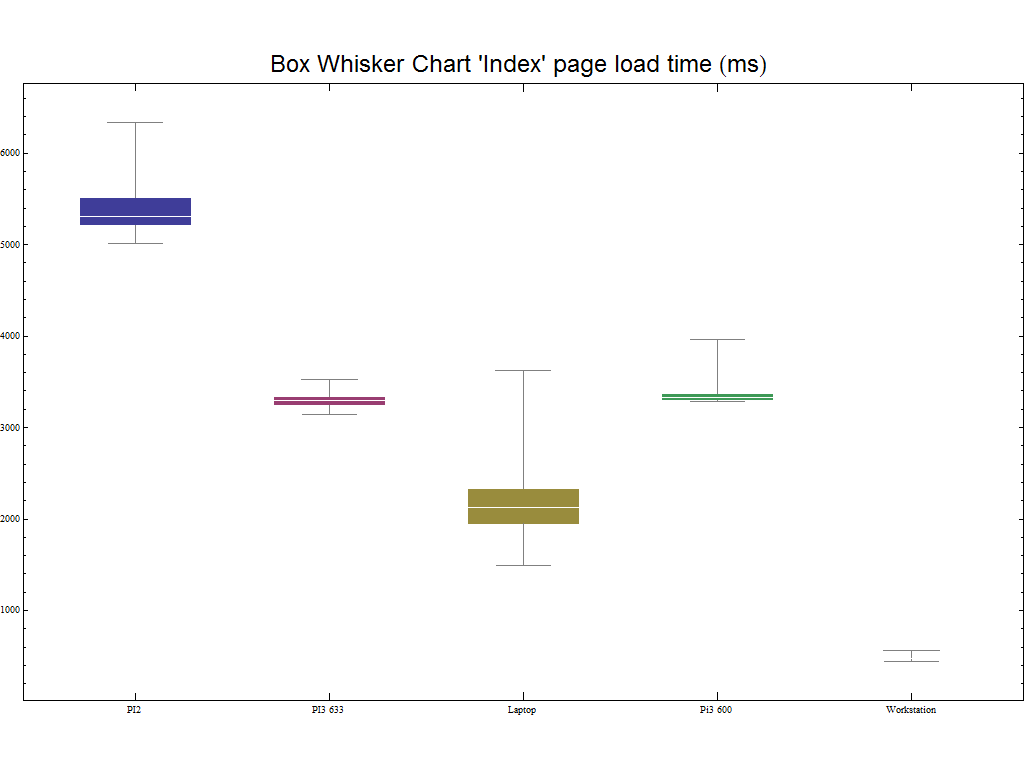
A summary of all average page load times is displayed in the table below:
| Test participant | Index | Bricks | Charts | Event Log |
|---|---|---|---|---|
| Rapberry PI2 TMOR Wheezy 32 GB Ultimate 633x Transcend | 5.40 sec | 35.97 sec | 31.52 sec | 1738 ms |
| Rapberry PI3 633TMOR Jessie 32 GB Ultimate 633x Transcend | 3.30 sec | 20.26 sec | 8.3 sec | 253 ms |
| Year 2012 Laptop i5 - Windows 7 SSD & 4 GB RAM | 2.16 sec | 10.81 sec | 18.9 sec | 93 ms |
| Rapberry PI3 600TMOR Jessie 32 GB Ultimate 600x Transcend | 3.35 sec | 17.72 sec | 8.5 sec | 283 ms |
| Year 2015 Workstation i7 - Windows 7 SSD & 32 GB RAM | 0.48 sec | 2.74 sec | 6.29 sec | 81 ms |
The test results do not differ too much from Release 1. The page load time of all four specimen pages has the same trend. Bricks page takes longest, while the Event Log page is fastest loaded. Release 2 provides, generally speaking, a slower user experience than Version 1. The following table displays the page load time difference between Release 2 and Release 1. Negative numbers in the table below are positive for user experience.
| Release Performance Difference (V2 - V1) | Index | Bricks | Charts | Event Log |
|---|---|---|---|---|
| Rapberry PI2 TMOR Wheezy 32 GB Ultimate 633x Transcend | +0.40 sec | +3.97 sec | -0.48 sec | +1281 ms |
| Rapberry PI3 633TMOR Jessie 32 GB Ultimate 633x Transcend | -0.70 sec | +2.26 sec | -2.7 sec | +23 ms |
| Year 2012 Laptop i5 - Windows 7 SSD & 4 GB RAM | +0.16 sec | +2.81 sec | 12.9 sec | -57 ms |
| Rapberry PI3 600TMOR Jessie 32 GB Ultimate 600x Transcend | N.A. | N.A. | N.A. | N.A. |
| Year 2015 Workstation i7 - Windows 7 SSD & 32 GB RAM | N.A. | N.A. | N.A. | N.A. |
Release V2.1.2 24.07.2017
Performance test setup for Release Version 2.1.2
| Test participant | SD Card/Memory | TMOR data base count | Color code |
|---|---|---|---|
| Rapberry PI2 TMOR Wheezy | 32 GB Ultimate 633x Transcend - Class 10 | approx. 664000 | Blue |
| Rapberry PI3 TMOR Jessie | 32 GB Ultimate 633x Transcend - Class 10 | approx. 641000 | Mangenta |
| Asus Tinker TMOR Linaro | 32 GB Ultimate 633x Transcend - Class 10 | approx. 641000 | Olive |
The three target system where tested with TMOR Version 2.1.2. Each test screen was called over 400 times. The test execution was conducted over 2 days. All systems where in the same LAN network.
Goal of this test is to answer the follwing question:
- How does the ASUS Tinker board performance impact the user experience?
- Is it worth to spend more money for an ASUS Tinker board instead of a Raspberry PI3?
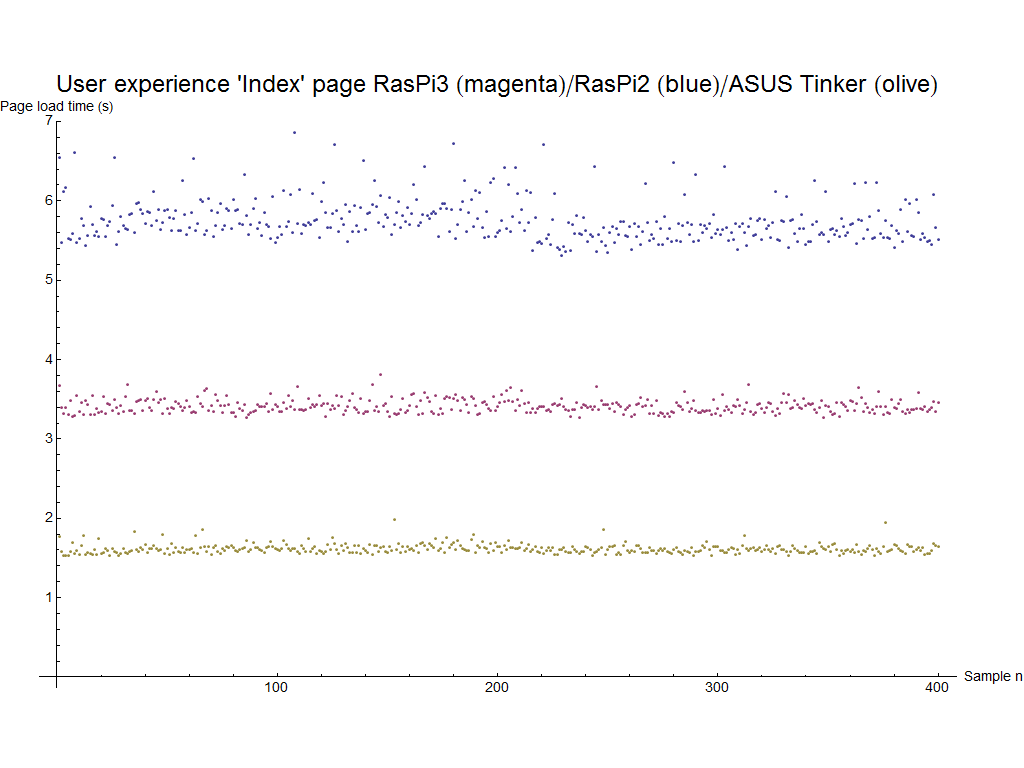
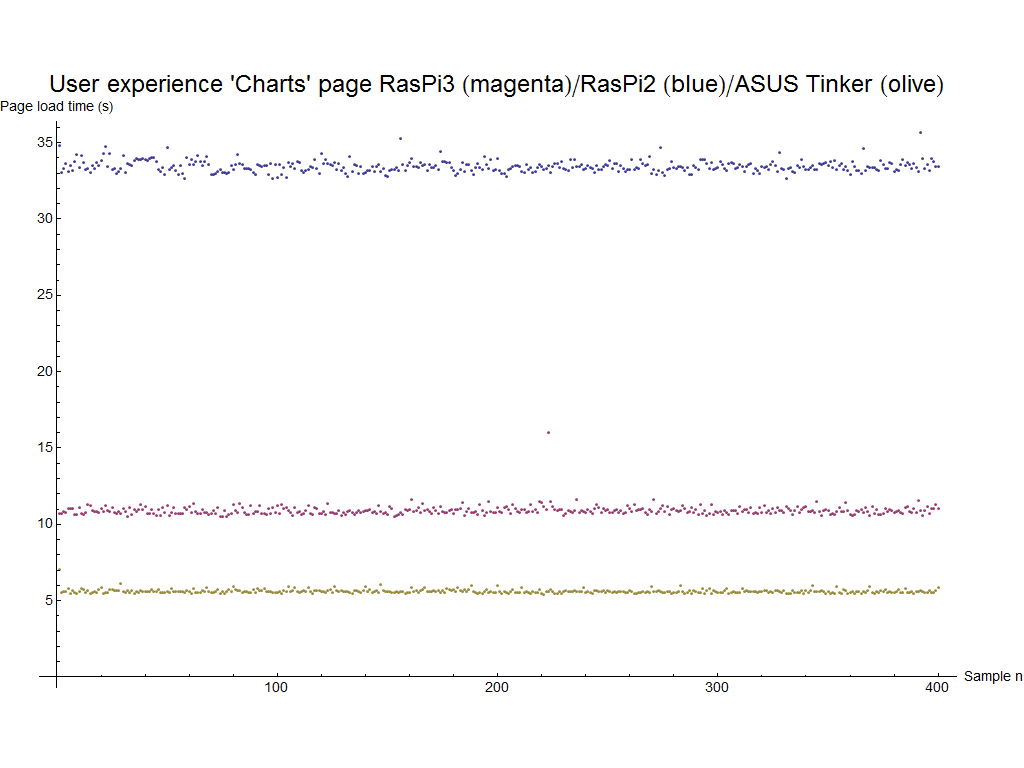
The list plots below shows the 3 * 400 calls to three different TMOR systems. The samples are in chronological order (e.g. sample no. 1 was obtained at the test begin and sample 400 was the last sample).
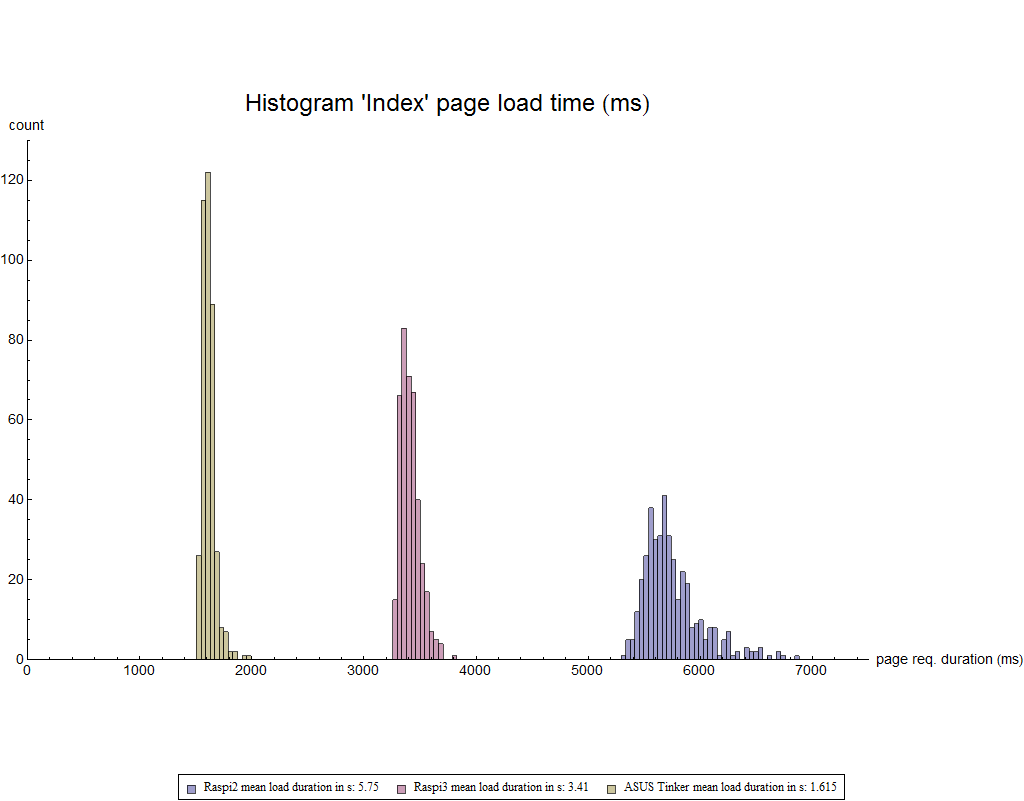
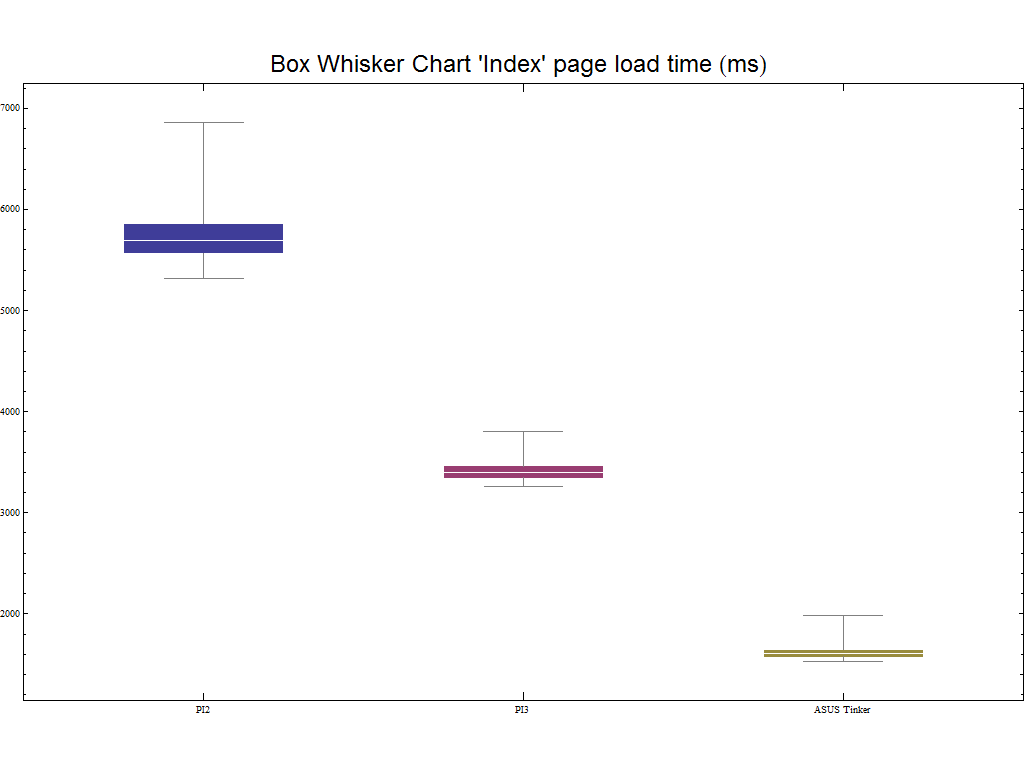
Page Index
The following grap shows, that the variance in the Index page response time is quite large.
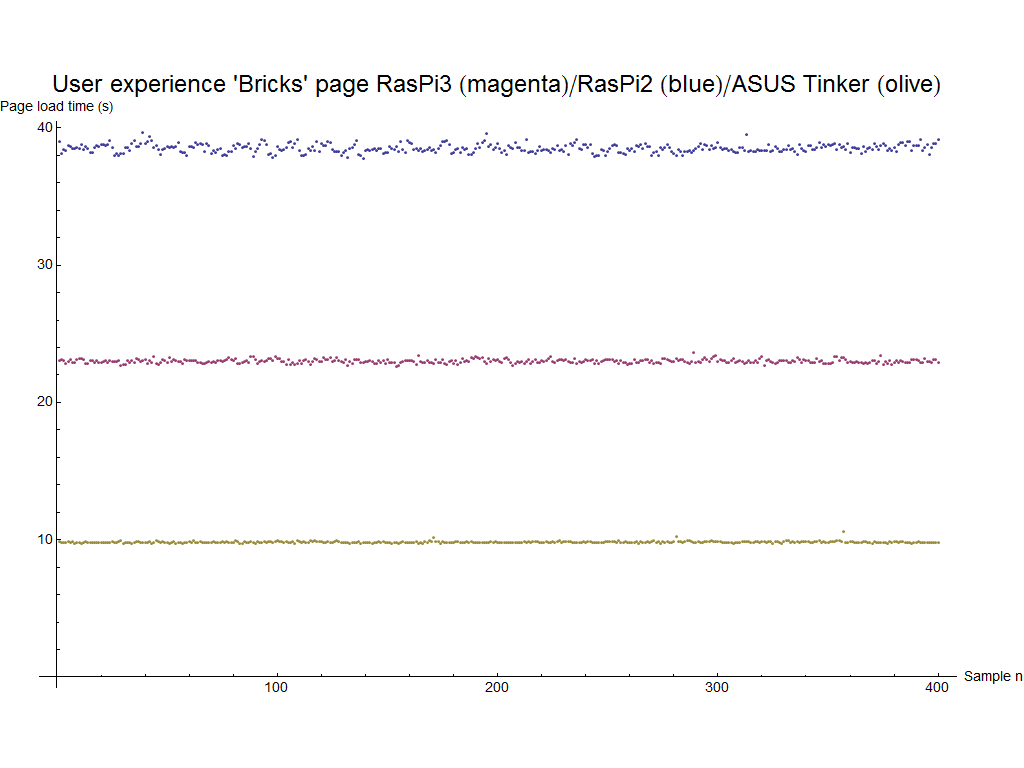
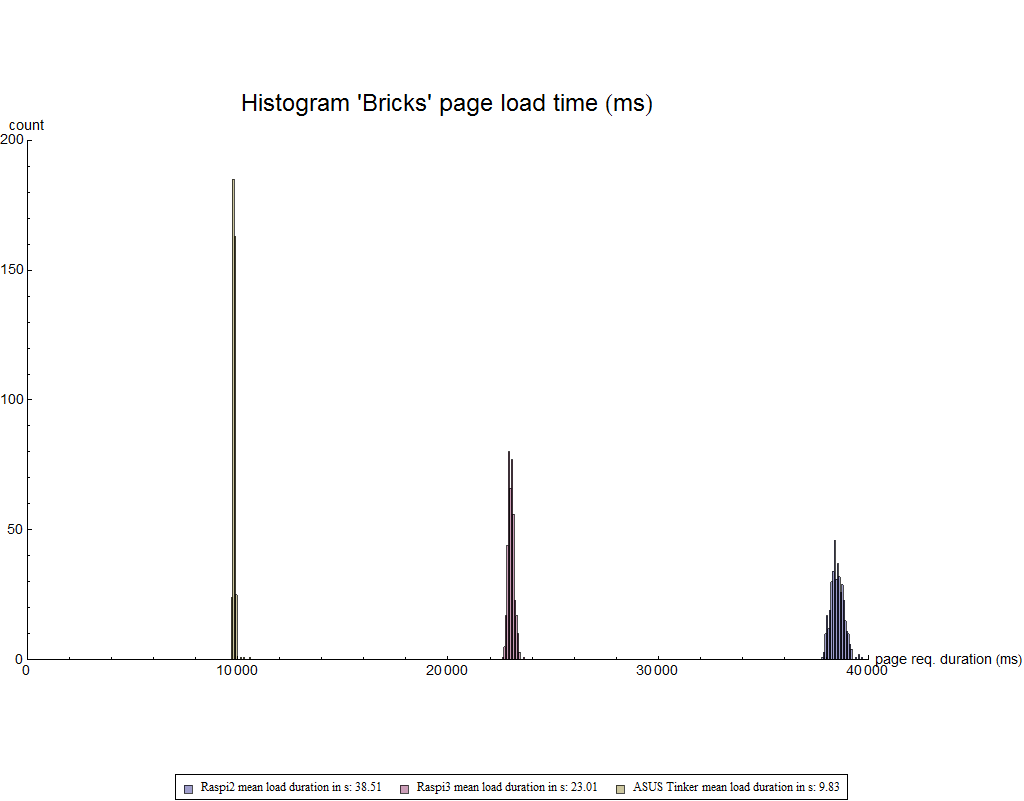
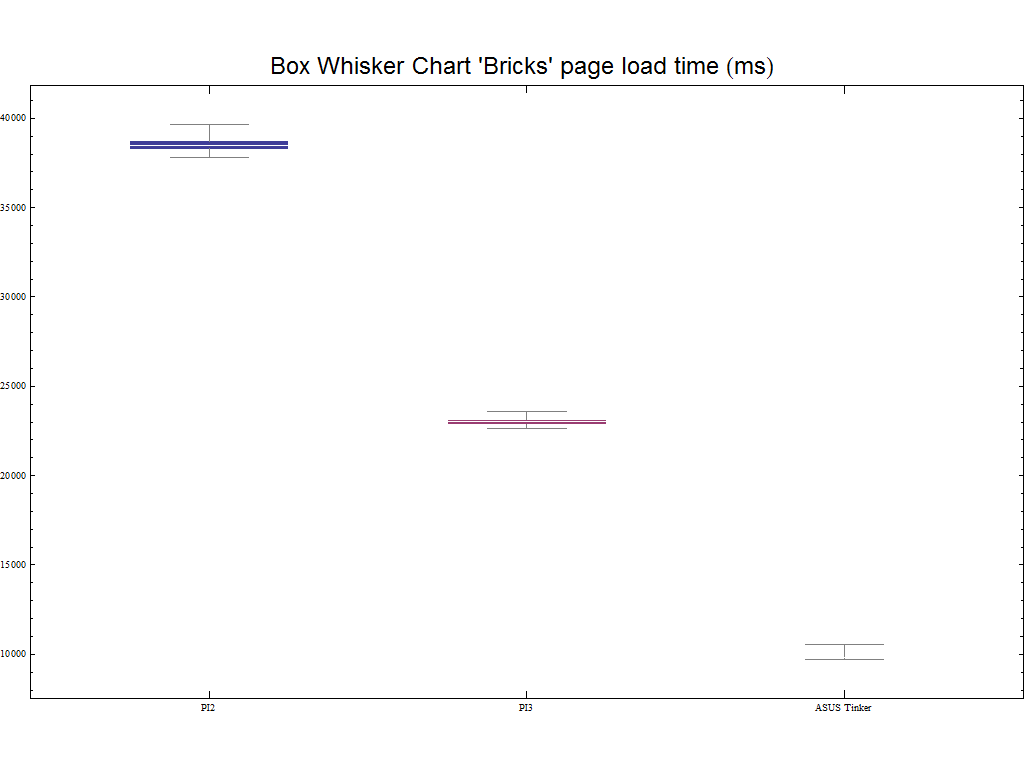
Page Bricks
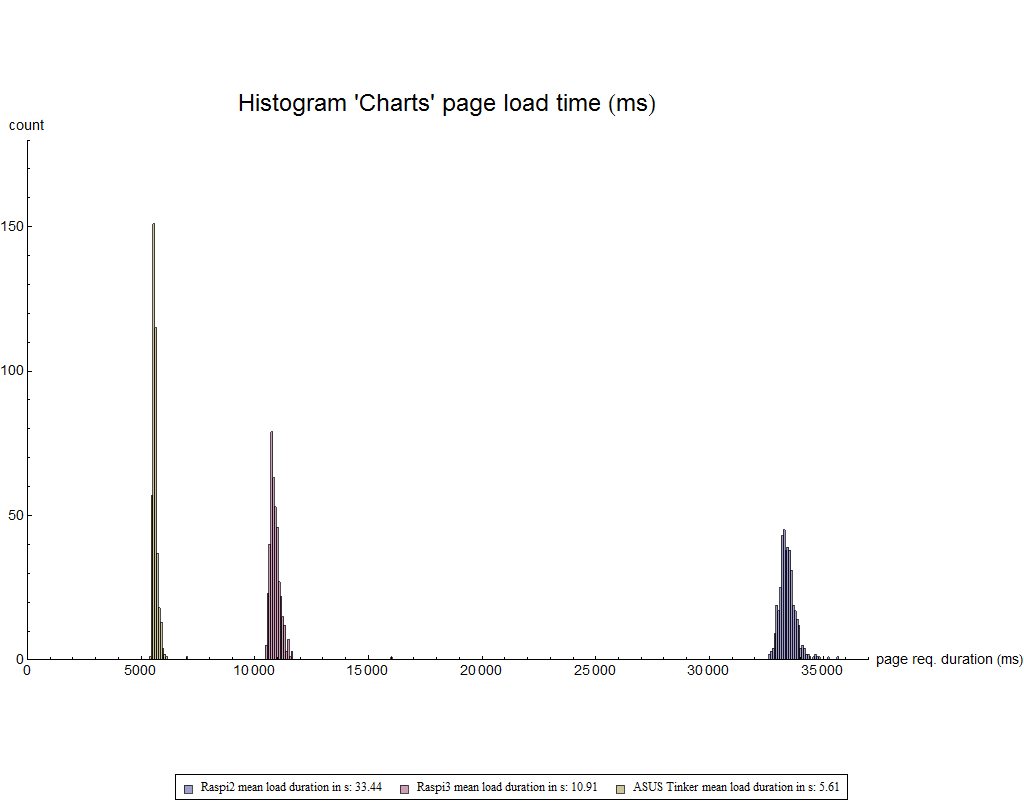
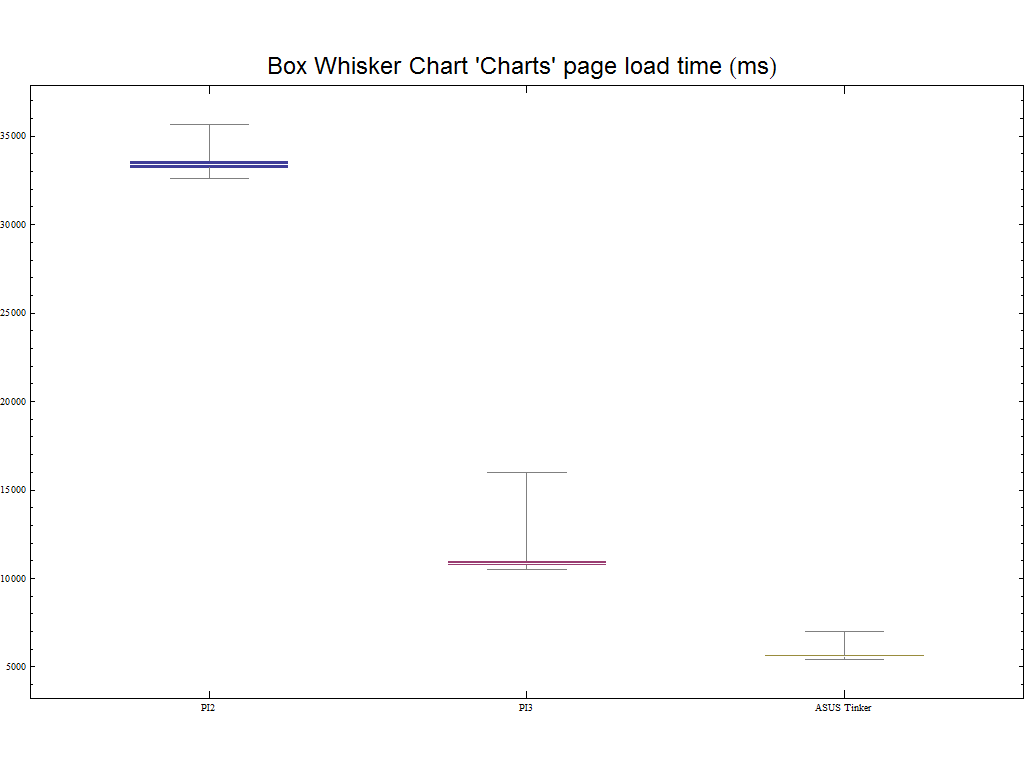
Page Charts
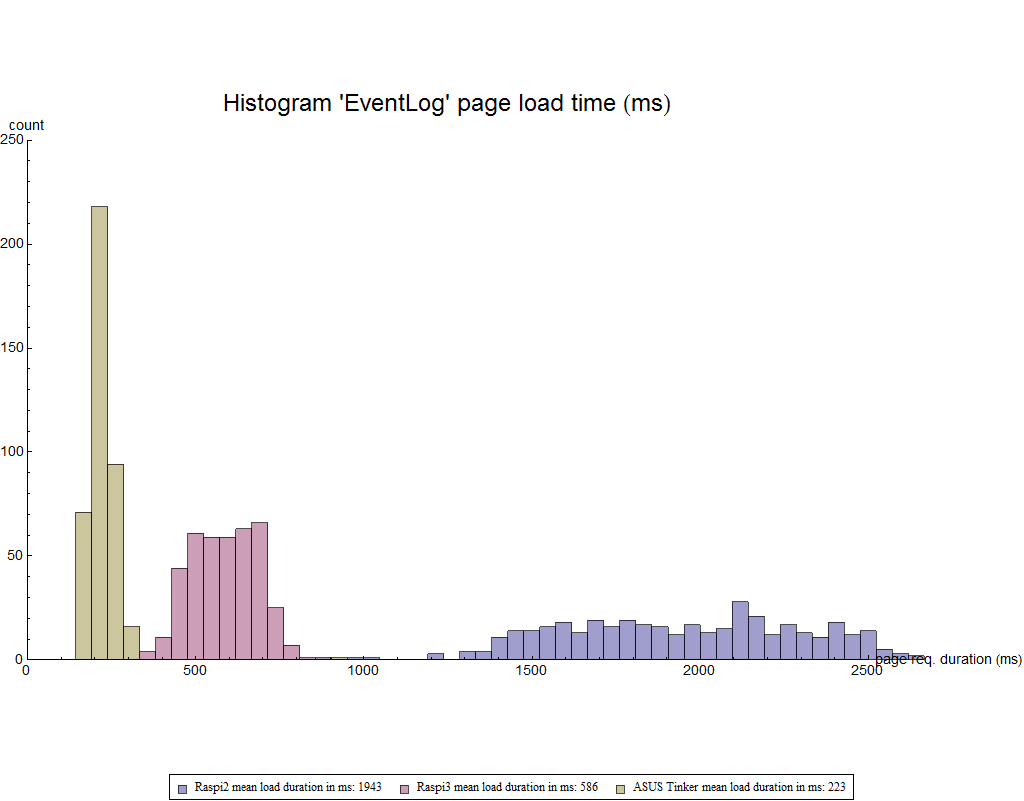
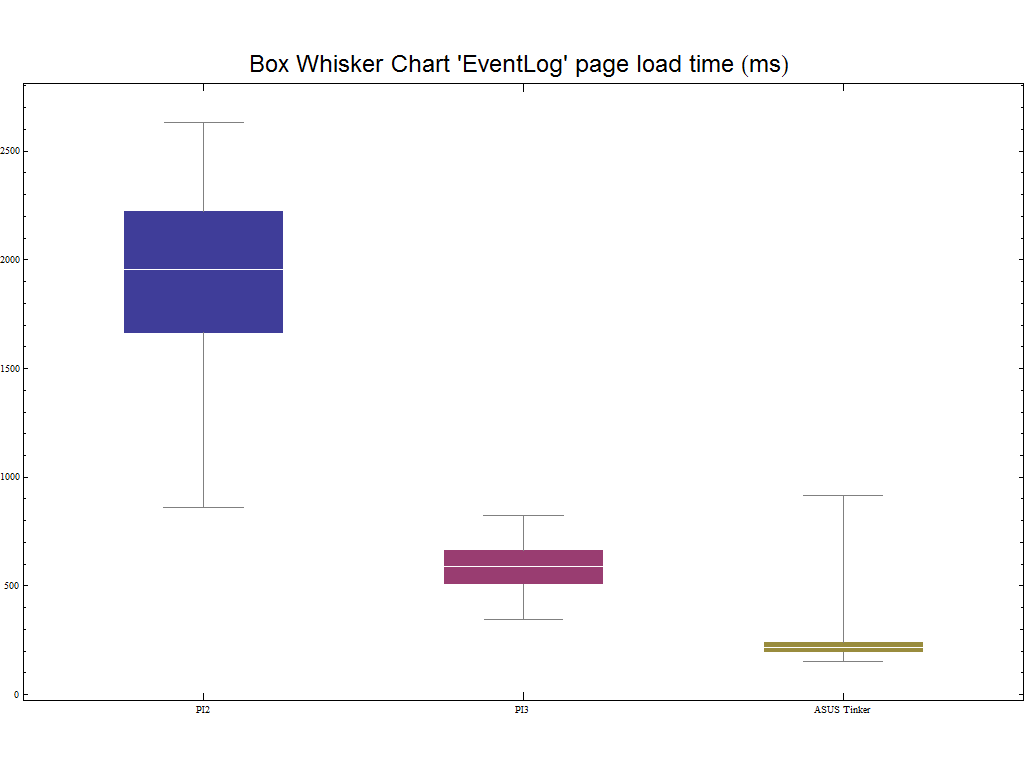
Page Event Log

Conclusion
A summary of all average page load times is displayed in the table below:
| Test participant | Index | Bricks | Charts | Event Log |
|---|---|---|---|---|
| Rapberry PI2 TMOR Wheezy 32 GB Ultimate 633x Transcend | 5.75 sec | 38.51 sec | 33.44 sec | 1943 ms |
| Rapberry PI3 TMOR Jessie 32 GB Ultimate 633x Transcend | 3.41 sec | 23.01 sec | 10.91 sec | 586 ms |
| Asus Tinker Board TMOR Linaro 32 GB Ultimate 633x Transcend | 1.62 sec | 9.83 sec | 5.61 sec | 223 ms |
By looking at the above stated average load time table, we can claim with certitude, that the Asus Tinker board is at least twice as fast as the Rasperry PI3 board. Hence user experience is greatly improved by running TMOR on an ASUS Tinker board. Price wise is the Tinker board almost twice as expensive as the Raspi 3. However, some TMOR functionality is not yet supported with the Tinker Board TMOR system (see Support Matrix).